- Current
- Browse
- Collections
-
For contributors
- For Authors
- Instructions to authors
- Article processing charge
- e-submission
- For Reviewers
- Instructions for reviewers
- How to become a reviewer
- Best reviewers
- For Readers
- Readership
- Subscription
- Permission guidelines
- About
- Editorial policy
Articles
- Page Path
- HOME > Diabetes Metab J > Volume 44(6); 2020 > Article
-
Original ArticleBasic Research Hypoxia Increases β-Cell Death by Activating Pancreatic Stellate Cells within the Islet
-
Jong Jin Kim
 , Esder Lee, Gyeong Ryul Ryu, Seung-Hyun Ko, Yu-Bae Ahn, Ki-Ho Song
 -
Diabetes & Metabolism Journal 2020;44(6):919-927.
DOI: https://doi.org/10.4093/dmj.2019.0181
Published online: May 11, 2020
Division of Endocrinology and Metabolism, Department of Internal Medicine, College of Medicine, The Catholic University of Korea, Seoul, Korea
- Corresponding author: Ki-Ho Song. Division of Endocrinology and Metabolism, Department of Internal Medicine, Yeouido St. Mary's Hospital, College of Medicine, The Catholic University of Korea, 10 63(yuksam)-ro, Yeongdeungpo-gu, Seoul 07345, Korea. kihos@catholic.ac.kr
Copyright © 2020 Korean Diabetes Association
This is an Open Access article distributed under the terms of the Creative Commons Attribution Non-Commercial License (http://creativecommons.org/licenses/by-nc/4.0/) which permits unrestricted non-commercial use, distribution, and reproduction in any medium, provided the original work is properly cited.
ABSTRACT
-
Background
- Hypoxia can occur in pancreatic islets in type 2 diabetes mellitus. Pancreatic stellate cells (PSCs) are activated during hypoxia. Here we aimed to investigate whether PSCs within the islet are also activated in hypoxia, causing β-cell injury.
-
Methods
- Islet and primary PSCs were isolated from Sprague Dawley rats, and cultured in normoxia (21% O2) or hypoxia (1% O2). The expression of α-smooth muscle actin (α-SMA), as measured by immunostaining and Western blotting, was used as a marker of PSC activation. Conditioned media (hypoxia-CM) were obtained from PSCs cultured in hypoxia.
-
Results
- Islets and PSCs cultured in hypoxia exhibited higher expressions of α-SMA than did those cultured in normoxia. Hypoxia increased the production of reactive oxygen species. The addition of N-acetyl-L-cysteine, an antioxidant, attenuated the hypoxia-induced PSC activation in islets and PSCs. Islets cultured in hypoxia-CM showed a decrease in cell viability and an increase in apoptosis.
-
Conclusion
- PSCs within the islet are activated in hypoxia through oxidative stress and promote islet cell death, suggesting that hypoxia-induced PSC activation may contribute to β-cell loss in type 2 diabetes mellitus.
- Pancreatic β-cell failure caused by β-cell dysfunction or loss plays an important role in the progression of type 2 diabetes mellitus (T2DM). The mechanisms underlying the process include oxidative stress, inflammation, endoplasmic reticulum stress, amyloid aggregation, islet fibrosis, and dedifferentiation [1]. Because the interventions currently available do not prevent the progression of T2DM, additional studies are necessary for a better understanding of the pathogenesis of β-cell failure.
- The exposure of pancreatic islets to hypoxia may be another mechanism leading to β-cell failure in long-standing T2DM. Moreover, hypoxia in islet grafts is associated with β-cell death after islet transplantation [2]. Previous studies suggest that β-cells can become hypoxic because of the high oxygen consumption during insulin secretion, especially when the oxygen supply is not sufficient [34]. Recently, Bensellam et al. [5] reported that hypoxia inhibited the adaptive unfolded protein response and endoplasmic reticulum-to-Golgi protein trafficking in β-cells with increased β-cell death. In addition, a compensatory increase in β-cell mass may compromise for the vascular density to maintain sufficient perfusion or oxygen delivery to the islet [6]. Abnormal islet vasculature including capillary loss and pancreatic arteriolosclerosis was also observed in T2DM [78]. Moreover, hypoxia induces oxidative stress [9], thus possibly aggravating hyperglycemia-induced oxidative stress.
- Interestingly, hypoxia is known to activate pancreatic stellate cells (PSCs) [1011]. PSCs play a crucial role in the pathogenesis of chronic pancreatitis and pancreatic cancer [12]. When PSCs transform from a quiescent state into an activated state, they exhibit a myofibroblastic phenotype, express α-smooth muscle actin (α-SMA) and produce collagen and other extracellular matrix proteins. The persistent activation of PSCs leads to fibrosis, which is associated with chronic pancreatitis and pancreatic cancer [1314]. Interestingly, we and others have demonstrated that PSCs are also present within the islet and are activated in high glucose conditions and animal models of T2DM [15161718192021]. Furthermore, Zha et al. [22] isolated PSC-like cells from cultured rat islets and termed them islet stellate cells (ISCs). PSC activation in the islet may damage β-cells indirectly by promoting islet fibrosis, which may accelerate β-cell destruction or induce the disruption of β-cell connectivity [232425]. Moreover, activated PSCs may damage β-cells directly by diminishing insulin secretion and inducing apoptosis [262728].
- Therefore, exposure of the islet to hypoxia might induce the activation of intra-islet PSCs, which in turn would damage β-cells leading to the progressive β-cell failure observed in T2DM. However, few studies have addressed this possibility. Here, we examined the hypoxia-induced activation of PSCs and its underlying mechanism, as well as the detrimental effect of activated PSCs on β-cell viability.
INTRODUCTION
- Isolation and culture of rat islets and primary PSCs
- Islets were isolated from 7-week-old Sprague Dawley (SD) rats and cultured in RPMI 1640 medium containing 11.1 mM glucose and 10% FBS. Primary PSCs were isolated from 14-week-old SD rats as reported previously [2021]. PSCs were cultured in DMEM/Ham's F-12 medium (1:1) containing 17.5 mM glucose and 16% fetal calf serum. The experiments were performed using PSCs at passages 1 to 6 after isolation, except for those that required freshly isolated PSCs. PSCs and islets were incubated in normoxia (20% O2) or hypoxia (1% O2) using a hypoxic chamber (Galaxy 14S; Eppendorf, Hamburg, Germany). The experimental protocol was approved by the Institutional Animal Care and Use Committee in School of Medicine, The Catholic University of Korea (CUMC-2018-0209-03).
- Immunohistochemistry
- Pimonidazole staining was performed to detect decreased cellular oxygen tension in islets using a commercial kit (Hypoxyprobe Kit; Hypoxyprobe, Burlington, MA, USA) with 10 µM pimonidazole for 2 hours in normoxia or hypoxia.
- α-SMA staining was performed to detect activated PSCs among primary PSCs and islets, as α-SMA expression is the most commonly used index of PSC activation [13]. Primary PSCs were cultured on cover glasses coated with poly-L-lysine. The cells were fixed in 4% paraformaldehyde and incubated overnight at 4℃ with a mouse anti-α-SMA antibody (1:400; Sigma-Aldrich, St. Louis, MO, USA). The cells were then incubated with a rhodamine-labeled anti-mouse IgG antibody (1:100) as the secondary antibody. The nuclei were stained with 4′,6-diamidino-2-phenyl-indole (DAPI). The percentage of a-SMA-positive cells among primary PSCs was calculated. Islets were fixed in 4% paraformaldehyde, and pelleted in 2.5% agar (US Biological, Salem, MA, USA). The specimens were embedded in paraffin, and cut into 3 µm. The sections were incubated overnight at 4℃ with the mouse anti-α-SMA-antibody (1:400; Sigma-Aldrich), as the primary antibody followed by incubation with a biotin-conjugated rabbit anti-mouse IgG and avidin-biotin complex (VECTASTAIN ABC Kit; Vector Laboratories, Burlingame, CA, USA), as the secondary antibody. The slides were developed using diaminobenzidine (Sigma-Aldrich) and counterstained with hematoxylin. The percentage of the α-SMA-stained area per islet section was calculated.
- Western blot analysis
- Western blot analyses were performed as described previously [15]. The primary antibodies used were the anti-α-SMA antibody (1:2,000; Sigma-Aldrich) and anti-β-actin antibody (1:10,000; Abcam, Cambridge, MA, USA).
- Measurement of reactive oxygen species
- To measure the production of measurement of reactive oxygen species (ROS), PSCs were loaded with 10 µM dichlorodihydrofluorescein diacetate (DCF; Molecular Probes, Eugene, OR, USA) for 30 minutes at 37℃. The cells were analyzed using a luminometer (excitation/emission at λ=490/535 nm) in a black 96-well plate. A fluorescence microscope was used to observe DCF fluorescence.
- Preparation of conditioned media from PSCs
- Primary PSCs at passage 1 to 3 after isolation were grown to 80% confluence, then cultured for 48 hours in normoxia or hypoxia. The media were collected, centrifuged to remove cells, and stored at −20℃ until use. For control experiments, conditioned media (CM) from C2C12 cells (a mouse myoblast cell line) were prepared in the same way.
- Cell viability and apoptosis assay
- Rat islets were incubated for 48 hours in media for culturing PSCs (PSC media), CM from PSCs in normoxia (normoxia-CM) and hypoxia (hypoxia-CM), and CM from C2C12 cells in normoxia and hypoxia. Cell viability was determined using acridine orange (AO)/propidium iodide (PI) staining. Islets were visualized using a fluorescence microscope. Digitalized images were captured and the areas that were stained with PI were quantified using Adobe Photoshop CS 8.0 (Adobe Systems Incorporated, San Jose, CA, USA). In addition, a terminal deoxynucleotidyl transferase-mediated dUTP nick-end labeling (TUNEL) assay was performed to detect apoptosis in islets, as described previously [29]. Islets were fixed with 4% paraformaldehyde, pelleted in 2.5% agar, and embedded in paraffin. The In Situ Cell Death Detection Kit, Fluorescein (Roche Diagnostics, Mannheim, Germany) was used. Apoptotic cells (TUNEL-positive cells) were quantified using a fluorescence microscope. Nuclei were stained with DAPI.
- Detection of various cytokines released from PSCs
- Various cytokines, including the tumor necrosis factor-α (TNF-α), interleukin-1β (IL-1β), and interferon-γ (IFN-γ), were measured in PSC media and normoxia-CM and hypoxia-CM from PSCs using a multiplex enzyme-linked immunosorbent assay (ELISA) kit (Rat Inflammatory Cytokines Multi-Analyte ELISArray Kit; Qiagen, Hilden, Germany) and individual ELISA kits (Abcam).
- Statistical analysis
- Data are expressed as the mean±standard error of the mean (SEM). Differences between groups were evaluated using GraphPad Prism version 3.02 (GraphPad Software, San Diego, CA, USA). To analyze the quantitative variables between groups, Student's t-test or analysis of variance (ANOVA) with post hoc test for multiple comparisons was used. P values of <0.05 were considered to show significance.
METHODS
- Activation of PSCs within the islet after exposure of hypoxia
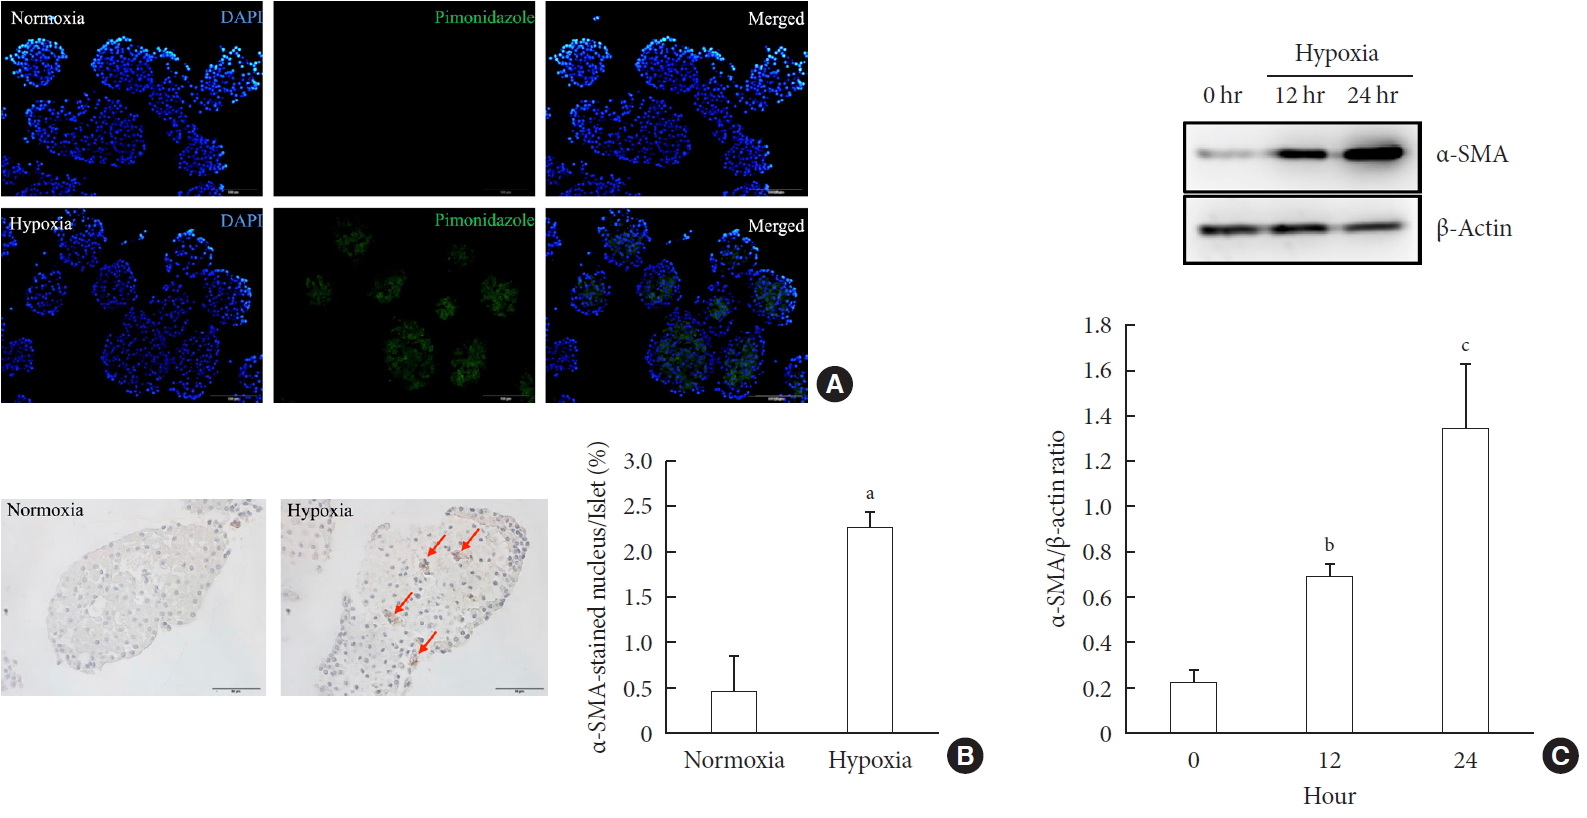
- First, we performed pimonidazole staining in islets. We detected pimonidazole adducts in islets cultured in 1% hypoxia, but not in 20% normoxia, thus confirming the presence of cellular hypoxia under this condition (Fig. 1A). Next, we examined the presence of PSC activation in islets after exposure to hypoxia or normoxia for up to 24 hours. Immunostaining showed the existence of multiple α-SMA-positive cells in islets cultured in hypoxia, indicating the presence of activated PSCs. The percentage of α-SMA-positive cells in islets cultured in hypoxia was significantly higher than that detected in islets cultured in normoxia (2.25%±0.19% vs. 0.47%±0.39%; P<0.05) (Fig. 1B). Western blot analysis also showed a significant increase in the expression of α-SMA in islets cultured in hypoxia (Fig. 1C).
- Activation of primary PSCs after exposure to hypoxia
- Freshly isolated PSCs were incubated in hypoxia or normoxia for 48 hours. α-SMA staining showed that most PSCs exposed to hypoxia transformed into a myofibroblast-like phenotype, whereas most PSCs exposed to normoxia remained quiescent (Fig. 2).
- Involvement of oxidative stress in PSC activation after exposure of hypoxia
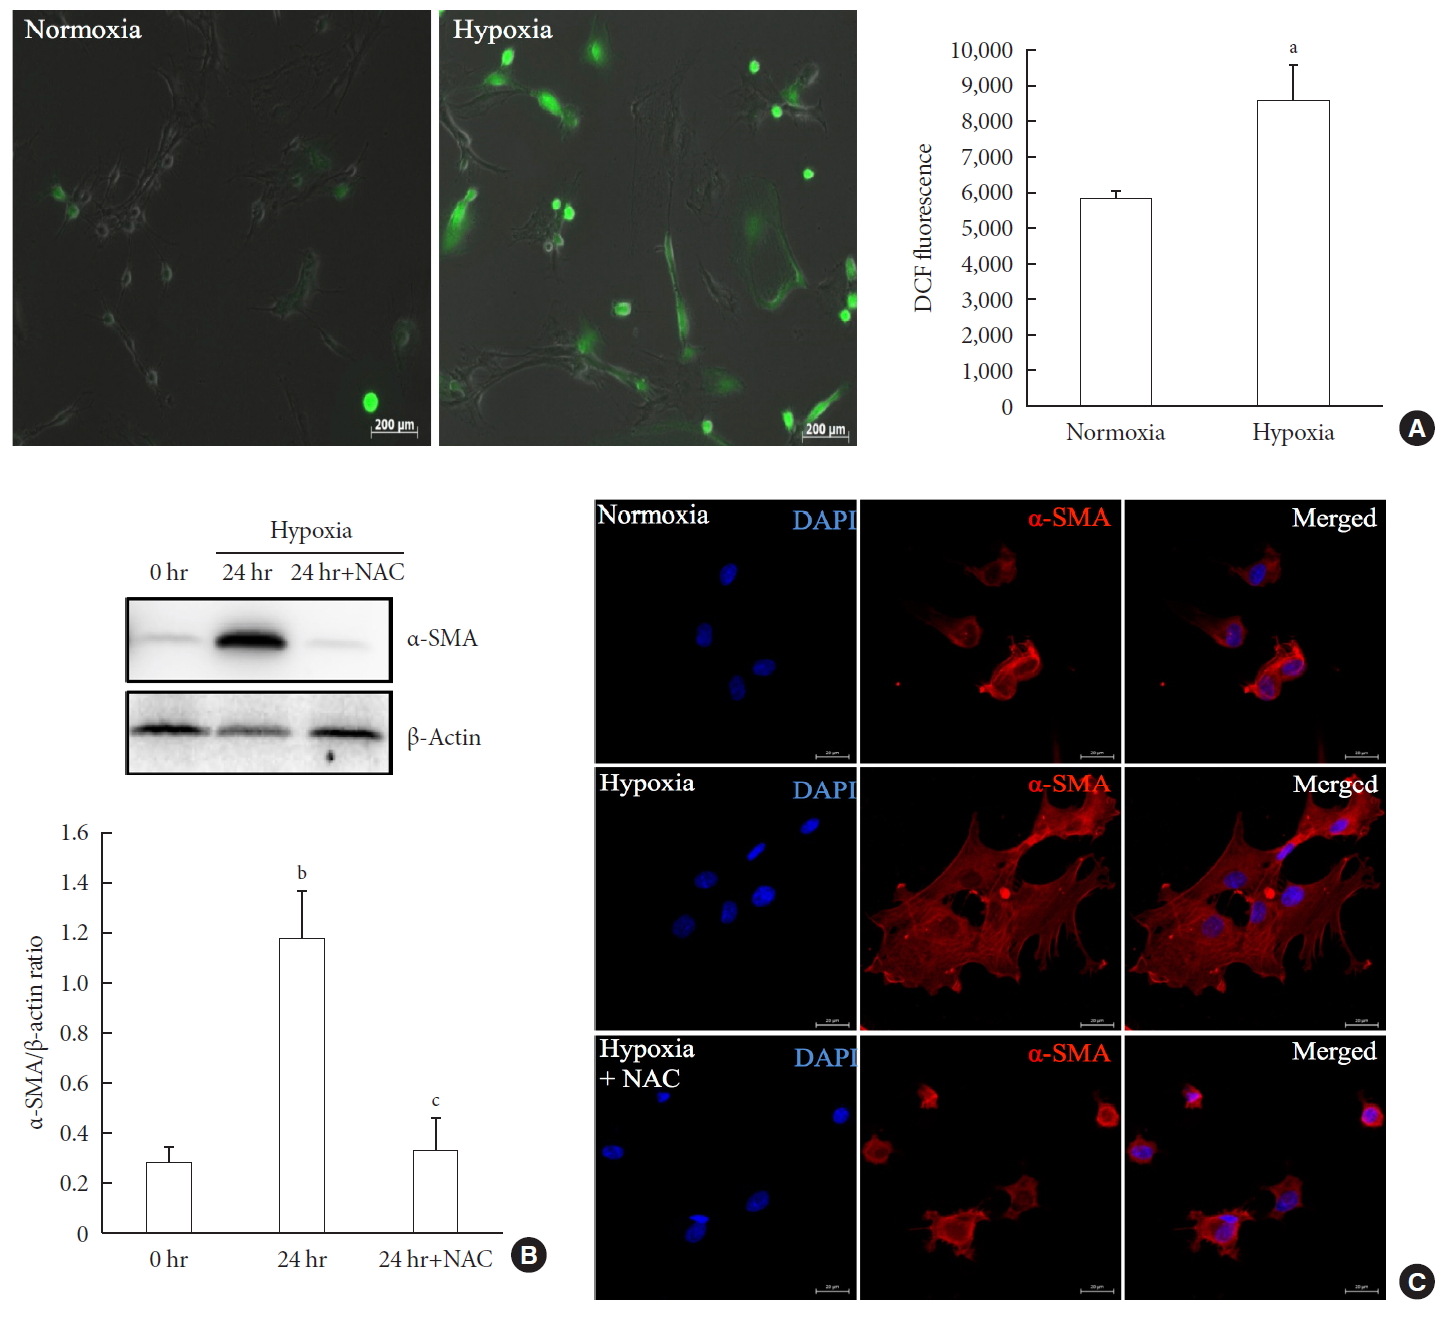
- To measure ROS generation, primary PSCs were exposed to DCF, a fluorescent marker of cellular oxidant production. Fig. 3A shows that exposure to hypoxia for 48 hours induced a higher fluorescence intensity compared with normoxia, which indicated the induction of oxidative stress by hypoxia. To investigate whether the hypoxia-induced facilitation of PSC activation was prevented by antioxidant treatment, we added 2.5 mM N-acetyl-L-cysteine (NAC) to islets cultured in hypoxia for 24 hours. Western blot analysis showed a significant attenuation of the upregulation of a-SMA induced by hypoxia (Fig. 3B). In addition, α-SMA staining of primary PSCs cultured in hypoxia with or without 2.5 mM NAC for 48 hours confirmed that NAC treatment attenuated the activation of PSCs (Fig. 3C).
- Effect of PSC activation on islet viability
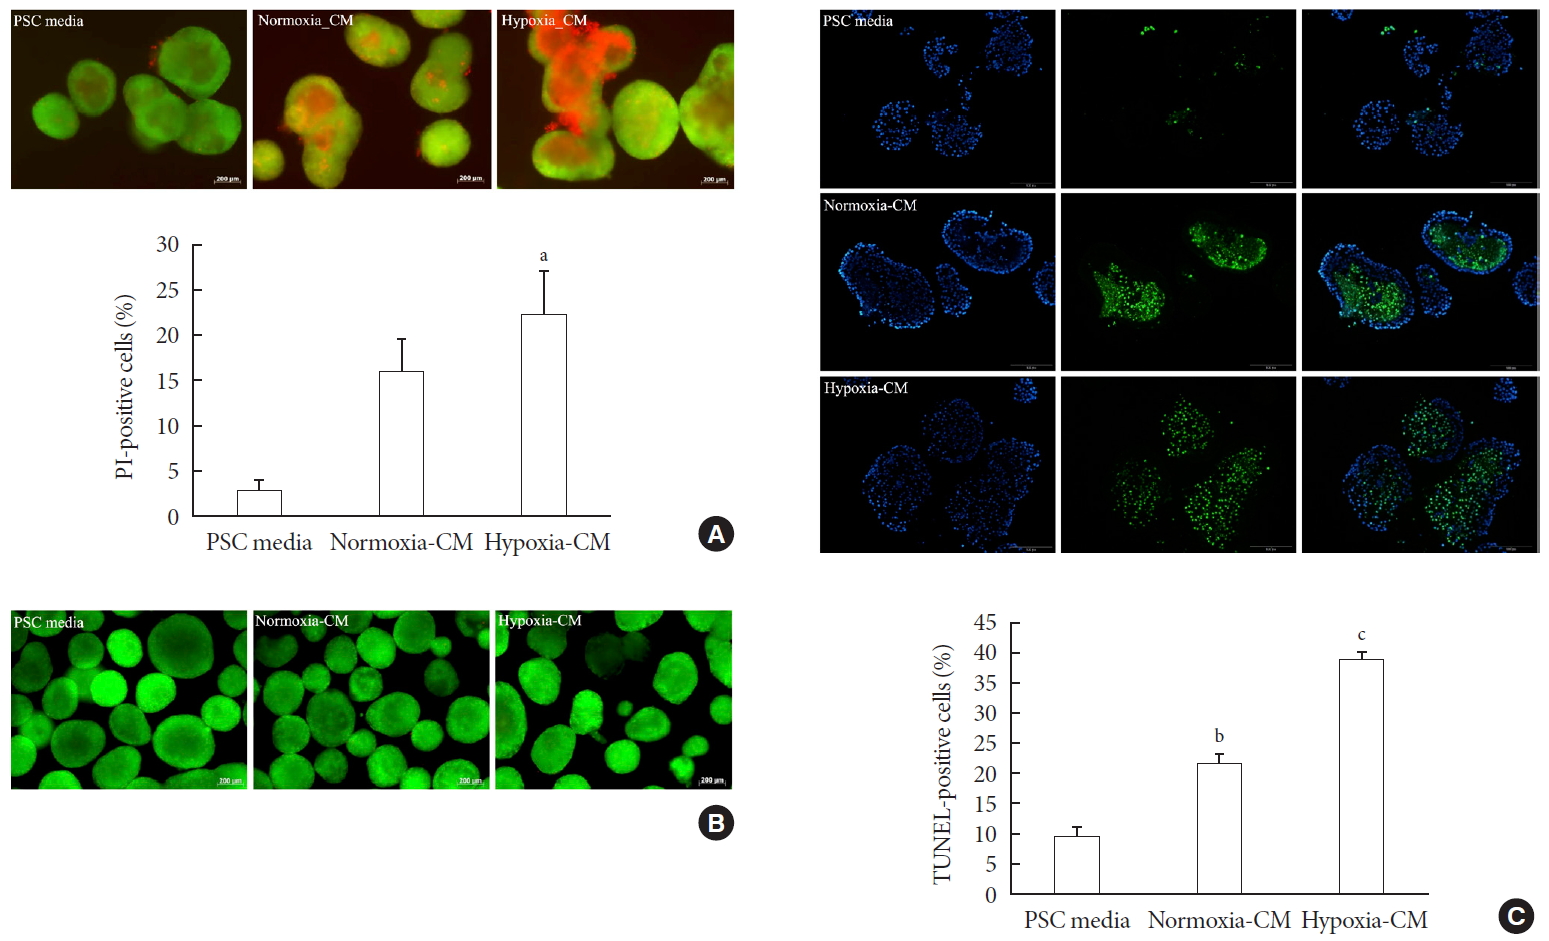
- To examine the effect of PSC activation on β-cell survival, we incubated islets for 48 hours in PSC media, normoxia-CM, and hypoxia-CM obtained from primary PSCs, and CM from C2C12 cells in normoxia and hypoxia. The AO/PI staining showed that islets incubated with hypoxia-CM from PSCs exhibited increased cell death compared with those incubated with PSC media (PI-positive cells: 22.45%±4.71% vs. 2.84%±1.35%, P<0.05) (Fig. 4A). In contrast, CM from C2C12 cells did not affect islet survival (Fig. 4B). In addition, the TUNEL assay showed that islets incubated with hypoxia-CM from PSCs contained more TUNEL-positive cells (38.32%±1.70%) than did those incubated with normoxia-CM (21.50%±1.75%) or PSC media (9.77%±1.50%) (all P<0.05) (Fig. 4C).
- Measurement of various cytokines in conditioned media from PSCs
- To examine whether cytokines released from PSCs induced islet cell death, we measured the levels of various cytokines in PSC media, normoxia-CM, and hypoxia-CM from PSCs using two different ELISA kits. However, none of these cytokines were detected (Tables 1 and 2).
RESULTS
- We demonstrated for the first time that hypoxia activates PSCs within the islet by inducing oxidative stress. We further showed that hypoxia-activated PSCs increase β-cell death via apoptosis.
- Hypoxia activates PSCs, which contribute to pancreatic cancer progression [1011]. To our knowledge, however, no study has demonstrated that hypoxia activates PSCs present within the islet. To induce cellular hypoxia, we incubated rat islets in 1% hypoxic conditions. Detection of pimonidazole adducts inislets indicates the presence of severe hypoxia [30]. After hypoxic exposure, an increased number of α-SMA-positive cells was observed in islets, together with an increase in the expression of the α-SMA protein, as measured by Western blot analysis. We also isolated primary rat PSCs and incubated them in hypoxic conditions. Consistent with previous reports [1011], most PSCs exposed to hypoxia became activated.
- Oxidative stress plays an important role in PSC activation [3132]. Hypoxia induces oxidative stress in PSCs [1011], as oxygen depletion stimulates mitochondria to produce ROS [3334]. Here, we found that ROS production was increased in PSCs during hypoxia. Co-treatment with NAC, an antioxidant, prevented the hypoxia-induced facilitation of PSC activation in islets and primary PSCs. These findings are consistent with a previous study reported by Lei et al. [11], which showed the suppressive effect of α-mangostin (an antioxidant) on hypoxia-induced PSC activation.
- Previous studies that were performed using cocultures of PSCs with RIN-5F cells or rat islets [2628] and treatment of INS-1 cells with CM from PSCs or ISCs [2735] demonstrated that activated PSCs could damage β-cells by reducing insulin secretion or inducing cell death and apoptosis. In this study, we measured cell death and apoptosis in cultured islets using AO/PI staining and the TUNEL assay, respectively. We found that islet cell death and apoptosis were more frequent after incubation with hypoxia-CM from PSCs compared with PSC media. This finding was specific to PSCs because CM from C2C12 cells did not affect islet survival. Our results suggest that mediators produced by PSCs induce cell death and apoptosis directly in β-cells. Therefore, we measured the levels of various cytokines, including TNF-α, IL-1β, or IFN-γ, which are known to induce apoptosis in β-cells [36], in CM from PSCs. However, none of these cytokines were detected.
- The current study had several limitations. First, we cultured the cells under severe hypoxic conditions. Second, we did not use ISCs isolated from the islet [22] in our experiment, but the characteristics of ISCs are similar to those of typical PSCs regarding biomarkers and activation [37]. Third, we were not able to detect cytokines in CM from PSCs, contrary to the findings of a previous study reported by Li et al. [35]. The reason for this discrepancy is not clear. Factors other than cytokines such as lipid substances, microRNAs, or exosomes could be more important in PSC activation-induced β-cell death. Exosomes are membrane-enclosed nanovesicles containing diverse bioactive molecules including lipids, proteins and microRNAs. It has been recognized that extracellular vesicles involving exosomes are significant mediators of communications between cells including PSCs [37]. Therefore, it is necessary to compare the exosomal cargo between the exosomes from the normoxia-CM and hypoxia-CM or between the exosomes from primary PSCs and C2C12 cells in the future.
- In conclusion, our data suggest that PSCs within the islet are activated in hypoxia through oxidative stress and promote β-cell apoptosis, suggesting that hypoxia-induced PSC activation contributes to β-cell loss. Therefore, therapies targeting PSC activation might be beneficial for the prevention of β-cell failure in T2DM and islet transplantation. However, additional studies are needed to elucidate the precise mechanism underlying the induction of β-cell death by PSC activation.
DISCUSSION
-
Acknowledgements
- None.
ACKNOWLEDGMENTS
-
CONFLICTS OF INTEREST
No potential conflict of interest relevant to this article was reported.
-
AUTHOR CONTRIBUTIONS
Conception or design: E.L., G.R.R., K.H.S.
Acquisition, analysis, or interpretation of data: J.J.K., E.L., G.R.R., S.H.K., Y.B.A., K.H.S.
Drafting the work or revising: J.J.K., K.H.S.
Final approval of the manuscript: J.J.K., E.L., G.R.R., S.H.K., Y.B.A., K.H.S.
NOTES
- 1. Halban PA, Polonsky KS, Bowden DW, Hawkins MA, Ling C, Mather KJ, Powers AC, Rhodes CJ, Sussel L, Weir GC. β-Cell failure in type 2 diabetes: postulated mechanisms and prospects for prevention and treatment. J Clin Endocrinol Metab 2014;99:1983-1992.ArticlePubMedPMCPDF
- 2. Olsson R, Olerud J, Pettersson U, Carlsson PO. Increased numbers of low-oxygenated pancreatic islets after intraportal islet transplantation. Diabetes 2011;60:2350-2353.ArticlePubMedPMCPDF
- 3. Sato Y, Endo H, Okuyama H, Takeda T, Iwahashi H, Imagawa A, Yamagata K, Shimomura I, Inoue M. Cellular hypoxia of pancreatic beta-cells due to high levels of oxygen consumption for insulin secretion in vitro. J Biol Chem 2011;286:12524-12532.PubMedPMC
- 4. Bensellam M, Duvillie B, Rybachuk G, Laybutt DR, Magnan C, Guiot Y, Pouyssegur J, Jonas JC. Glucose-induced O2 consumption activates hypoxia inducible factors 1 and 2 in rat insulin-secreting pancreatic beta-cells. PLoS One 2012;7:e29807.ArticlePubMedPMC
- 5. Bensellam M, Maxwell EL, Chan JY, Luzuriaga J, West PK, Jonas JC, Gunton JE, Laybutt DR. Hypoxia reduces ER-to-Golgi protein trafficking and increases cell death by inhibiting the adaptive unfolded protein response in mouse beta cells. Diabetologia 2016;59:1492-1502.ArticlePubMedPDF
- 6. Cantley J, Grey ST, Maxwell PH, Withers DJ. The hypoxia response pathway and β-cell function. Diabetes Obes Metab 2010;12 Suppl 2:159-167.ArticlePubMed
- 7. Zhao HL, Lai FM, Tong PC, Zhong DR, Yang D, Tomlinson B, Chan JC. Prevalence and clinicopathological characteristics of islet amyloid in Chinese patients with type 2 diabetes. Diabetes 2003;52:2759-2766.ArticlePubMedPDF
- 8. Hogan MF, Hull RL. The islet endothelial cell: a novel contributor to beta cell secretory dysfunction in diabetes. Diabetologia 2017;60:952-959.ArticlePubMedPMCPDF
- 9. Kaelin WG Jr. ROS: really involved in oxygen sensing. Cell Metab 2005;1:357-358.ArticlePubMed
- 10. Masamune A, Kikuta K, Watanabe T, Satoh K, Hirota M, Shimosegawa T. Hypoxia stimulates pancreatic stellate cells to induce fibrosis and angiogenesis in pancreatic cancer. Am J Physiol Gastrointest Liver Physiol 2008;295:G709-G717.ArticlePubMed
- 11. Lei J, Huo X, Duan W, Xu Q, Li R, Ma J, Li X, Han L, Li W, Sun H, Wu E, Ma Q. α-Mangostin inhibits hypoxia-driven ROS-induced PSC activation and pancreatic cancer cell invasion. Cancer Lett 2014;347:129-138.ArticlePubMedPMC
- 12. Omary MB, Lugea A, Lowe AW, Pandol SJ. The pancreatic stellate cell: a star on the rise in pancreatic diseases. J Clin Invest 2007;117:50-59.ArticlePubMedPMC
- 13. Bachem MG, Schneider E, Gross H, Weidenbach H, Schmid RM, Menke A, Siech M, Beger H, Grunert A, Adler G. Identification, culture, and characterization of pancreatic stellate cells in rats and humans. Gastroenterology 1998;115:421-432.ArticlePubMed
- 14. Apte MV, Haber PS, Darby SJ, Rodgers SC, McCaughan GW, Korsten MA, Pirola RC, Wilson JS. Pancreatic stellate cells are activated by proinflammatory cytokines: implications for pancreatic fibrogenesis. Gut 1999;44:534-541.ArticlePubMedPMC
- 15. Ko SH, Kwon HS, Kim SR, Moon SD, Ahn YB, Song KH, Son HS, Cha BY, Lee KW, Son HY, Kang SK, Park CG, Lee IK, Yoon KH. Ramipril treatment suppresses islet fibrosis in Otsuka Long-Evans Tokushima fatty rats. Biochem Biophys Res Commun 2004;316:114-122.ArticlePubMed
- 16. Ko SH, Hong OK, Kim JW, Ahn YB, Song KH, Cha BY, Son HY, Kim MJ, Jeong IK, Yoon KH. High glucose increases extracellular matrix production in pancreatic stellate cells by activating the renin-angiotensin system. J Cell Biochem 2006;98:343-355.ArticlePubMed
- 17. Nomiyama Y, Tashiro M, Yamaguchi T, Watanabe S, Taguchi M, Asaumi H, Nakamura H, Otsuki M. High glucose activates rat pancreatic stellate cells through protein kinase C and p38 mitogen-activated protein kinase pathway. Pancreas 2007;34:364-372.ArticlePubMed
- 18. Lee E, Ryu GR, Ko SH, Ahn YB, Yoon KH, Ha H, Song KH. Antioxidant treatment may protect pancreatic beta cells through the attenuation of islet fibrosis in an animal model of type 2 diabetes. Biochem Biophys Res Commun 2011;414:397-402.ArticlePubMed
- 19. Saito R, Yamada S, Yamamoto Y, Kodera T, Hara A, Tanaka Y, Kimura F, Takei I, Umezawa K, Kojima I. Conophylline suppresses pancreatic stellate cells and improves islet fibrosis in Goto-Kakizaki rats. Endocrinology 2012;153:621-630.ArticlePubMedPDF
- 20. Ryu GR, Lee E, Chun HJ, Yoon KH, Ko SH, Ahn YB, Song KH. Oxidative stress plays a role in high glucose-induced activation of pancreatic stellate cells. Biochem Biophys Res Commun 2013;439:258-263.ArticlePubMed
- 21. Lee E, Ryu GR, Ko SH, Ahn YB, Song KH. A role of pancreatic stellate cells in islet fibrosis and β-cell dysfunction in type 2 diabetes mellitus. Biochem Biophys Res Commun 2017;485:328-334.ArticlePubMed
- 22. Zha M, Li F, Xu W, Chen B, Sun Z. Isolation and characterization of islet stellate cells in rat. Islets 2014;6:e28701.ArticlePubMedPMC
- 23. Weir GC, Bonner-Weir S. Five stages of evolving beta-cell dysfunction during progression to diabetes. Diabetes 2004;53 Suppl 3:S16-S21.ArticlePubMedPDF
- 24. Hayden MR. Islet amyloid and fibrosis in the cardiometabolic syndrome and type 2 diabetes mellitus. J Cardiometab Syndr 2007;2:70-75.ArticlePubMed
- 25. Kim JW, Ko SH, Cho JH, Sun C, Hong OK, Lee SH, Kim JH, Lee KW, Kwon HS, Lee JM, Song KH, Son HY, Yoon KH. Loss of beta-cells with fibrotic islet destruction in type 2 diabetes mellitus. Front Biosci 2008;13:6022-6033.ArticlePubMed
- 26. Kikuta K, Masamune A, Hamada S, Takikawa T, Nakano E, Shimosegawa T. Pancreatic stellate cells reduce insulin expression and induce apoptosis in pancreatic β-cells. Biochem Biophys Res Commun 2013;433:292-297.ArticlePubMed
- 27. Zha M, Xu W, Zhai Q, Li F, Chen B, Sun Z. High glucose aggravates the detrimental effects of pancreatic stellate cells on beta-cell function. Int J Endocrinol 2014;2014:165612.ArticlePubMedPMCPDF
- 28. Zang G, Sandberg M, Carlsson PO, Welsh N, Jansson L, Barbu A. Activated pancreatic stellate cells can impair pancreatic islet function in mice. Ups J Med Sci 2015;120:169-180.ArticlePubMedPMC
- 29. Ko SH, Ryu GR, Kim S, Ahn YB, Yoon KH, Kaneto H, Ha H, Kim YS, Song KH. Inducible nitric oxide synthase-nitric oxide plays an important role in acute and severe hypoxic injury to pancreatic beta cells. Transplantation 2008;85:323-330.ArticlePubMed
- 30. Gross MW, Karbach U, Groebe K, Franko AJ, Mueller-Klieser W. Calibration of misonidazole labeling by simultaneous measurement of oxygen tension and labeling density in multicellular spheroids. Int J Cancer 1995;61:567-573.ArticlePubMed
- 31. Masamune A, Shimosegawa T. Signal transduction in pancreatic stellate cells. J Gastroenterol 2009;44:249-260.ArticlePubMedPDF
- 32. Yan B, Cheng L, Jiang Z, Chen K, Zhou C, Sun L, Cao J, Qian W, Li J, Shan T, Lei J, Ma Q, Ma J. Resveratrol inhibits ROS-promoted activation and glycolysis of pancreatic stellate cells via suppression of miR-21. Oxid Med Cell Longev 2018;2018:1346958.ArticlePubMedPMCPDF
- 33. Guzy RD, Schumacker PT. Oxygen sensing by mitochondria at complex III: the paradox of increased reactive oxygen species during hypoxia. Exp Physiol 2006;91:807-819.ArticlePubMedPDF
- 34. Chandel NS, Budinger GR. The cellular basis for diverse responses to oxygen. Free Radic Biol Med 2007;42:165-174.ArticlePubMed
- 35. Li FF, Chen BJ, Li W, Li L, Zha M, Zhou S, Bachem MG, Sun ZL. Islet stellate cells isolated from fibrotic islet of Goto-Kakizaki rats affect biological behavior of beta-cell. J Diabetes Res 2016;2016:6924593.ArticlePubMedPDF
- 36. Kim KA, Lee MS. Recent progress in research on beta-cell apoptosis by cytokines. Front Biosci (Landmark Ed) 2009;14:657-664.ArticlePubMed
- 37. Xue R, Jia K, Wang J, Yang L, Wang Y, Gao L, Hao J. A rising star in pancreatic diseases: pancreatic stellate cells. Front Physiol 2018;9:754.ArticlePubMedPMC
REFERENCES
Activation of pancreatic stellate cells (PSCs) in islets after hypoxia. (A) Images showing pimonidazole (green) staining of islets after incubation in normoxia or hypoxia for 2 hours. The nuclei were stained with 4′,6-diamidino-2-phenyl-indole (DAPI, blue). (B) Images showing α-smooth muscle actin (α-SMA) staining and the percentage of α-SMA-positive cells within the islet after incubation in normoxia or hypoxia for 12 hours. Arrows indicate cells expressing α-SMA (brown). Bar, 100 µm. (C) The expression of α-SMA in Western blot analysis. Values are mean±standard error of the mean (n=3). aP<0.05 for normoxia vs. hypoxia, bP<0.01 for 12 hours vs. 24 hours, cP<0.01 for 0 hour vs. 24 hours.
Activation of pancreatic stellate cells (PSCs) after hypoxia among freshly isolated PSCs. Images showing α-smooth muscle actin (α-SMA) staining and the percentage of activated PSCs after the cells were incubated in hypoxia or normoxia for 48 hours. Bar, 20 µm. Values are presented as mean±standard error of the mean (n=4). DAPI, 4′,6-diamidino-2-phenyl-indole. aP<0.05 for normoxia vs. hypoxia.

Involvement of oxidative stress in pancreatic stellate cell (PSC) activation after hypoxia. (A) Generation of reactive oxygen species. Images showing dichlorodihydrofluorescein diacetate (DCF) fluorescence (green) in PSCs after exposure to hypoxia or normoxia for 48 hours. DCF fluorescence was quantified using a scanning fluorometer. Bar, 200 µm. Values are presented as mean±standard error of the mean (n=6). (B) Western blot analysis showing the expression of α-smooth muscle actin (α-SMA) in islets after hypoxia in the presence or absence of treatment with 2.5 mM N-acetyl-L-cysteine (NAC). Values are presented as mean±standard error of the mean (n=3). (C) Representative images of α-SMA staining in primary PSCs cultured in hypoxia with or without 2.5 mM NAC for 48 hours. Bar, 20 µm. DAPI, 4′,6-diamidino-2-phenyl-indole. aP<0.05 for normoxia vs. hypoxia, bP<0.01 for 0 hr (0 hour) vs. 24 hr (24 hours), cP<0.05 for 24 hours vs. 24 hours+NAC.
Effect of pancreatic stellate cell (PSC) activation on islet viability. (A) Representative images of acridine orange (AO, green)/propidium iodide (PI, red) staining and quantification of PI-positive cells in rat islets incubated in PSC media and normoxia-conditioned media (CM) and hypoxia-CM from PSCs for 48 hours. Bar, 200 µm. (B) Representative images of AO/PI staining in rat islets incubated in PSC media and normoxia-CM and hypoxia-CM from C2C12 cells for 48 hours. Bar, 200 µm. (C) Representative images of terminal deoxynucleotidyl transferase-mediated dUTP nick-end labeling (TUNEL) assay and quantification of TUNEL-positive cells in rat islets incubated in PSC media and normoxia-CM and hypoxia-CM from PSCs for 48 hours. The nuclei were stained with 4′,6-diamidino-2-phenyl-indole (DAPI, blue). Bar, 100 µm. Values are presented as mean±standard error of the mean (n=3). aP<0.05 for PSC media vs. hypoxia-CM, bP<0.05 for PSC media vs. normoxia-CM, cP<0.05 for PSC media vs. hypoxia-CM and for normoxia-CM vs. hypoxia-CM.

Values are presented as absorbance values at 450 nm.
PSC, pancreatic stellate cell; ELISA, enzyme-linked immunosorbent assay; IL, interleukin; IFN-γ, interferon-γ; TNF-α, tumor necrosis factor-α; GM-CSF, granulocyte macrophage-colony stimulating factor; RANTES, regulated on activation normal T cell expressed and secreted; CM, conditioned media.
Figure & Data
References
Citations
- Effects of hypoxia in the diabetic corneal stroma microenvironment
Purnima Sharma, Jian-Xing Ma, Dimitrios Karamichos
Experimental Eye Research.2024; 240: 109790. CrossRef - Visualizing hypoxic modulation of beta cell secretions via a sensor augmented oxygen gradient
Kai Duan, Mengyang Zhou, Yong Wang, Jose Oberholzer, Joe F. Lo
Microsystems & Nanoengineering.2023;[Epub] CrossRef - Pancreatic stellate cells promote pancreatic β-cell death through exosomal microRNA transfer in hypoxia
Esder Lee, Gyeong Ryul Ryu, Seung-Hyun Ko, Yu-Bae Ahn, Ki-Ho Song
Molecular and Cellular Endocrinology.2023; 572: 111947. CrossRef - Pancreatic stellate cells in pancreatic cancer: as potential targets for future therapy
Zhengfeng Wang, Ru He, Shi Dong, Wence Zhou
Frontiers in Oncology.2023;[Epub] CrossRef - Recent advances in the development of bioartificial pancreas using 3D bioprinting for the treatment of type 1 diabetes: a review
Anushikha Ghosh, Arka Sanyal, Abhik Mallick
Exploration of Medicine.2023; : 886. CrossRef - Pancreas and islet morphology in cystic fibrosis: clues to the etiology of cystic fibrosis-related diabetes
Sarah S. Malik, Diksha Padmanabhan, Rebecca L. Hull-Meichle
Frontiers in Endocrinology.2023;[Epub] CrossRef - Diabetic mellitus, vascular calcification and hypoxia: A complex and neglected tripartite relationship
Xue-Jiao Sun, Nai-Feng Liu
Cellular Signalling.2022; 91: 110219. CrossRef - HIF-1 and NRF2; Key Molecules for Malignant Phenotypes of Pancreatic Cancer
Shin Hamada, Ryotaro Matsumoto, Atsushi Masamune
Cancers.2022; 14(2): 411. CrossRef - Pancreatic Stellate Cells and Metabolic Alteration: Physiology and Pathophysiology
Shin Hamada, Ryotaro Matsumoto, Atsushi Masamune
Frontiers in Physiology.2022;[Epub] CrossRef - Exosomal miR-140–3p and miR-143–3p from TGF-β1-treated pancreatic stellate cells target BCL2 mRNA to increase β-cell apoptosis
Xiangyun Zhu, Dechen Liu, Guoqing Li, Mengmeng Zhi, Ji Sun, Liang Qi, Jingbo Li, Stephen J. Pandol, Ling Li
Molecular and Cellular Endocrinology.2022; 551: 111653. CrossRef - Mitochondria oxidative stress mediated nicotine-promoted activation of pancreatic stellate cells by regulating mitochondrial dynamics
Yue Yuan, Zhiren Li, Miaomiao Li, Tong Jin, Xiaoyun Zhang, Xinjuan Liu, Jianyu Hao
Toxicology in Vitro.2022; 84: 105436. CrossRef - Antioxidant Mitoquinone Alleviates Chronic Pancreatitis via Anti-Fibrotic and Antioxidant Effects
Miaomiao Li, Yue Yuan, Xue Han, Xinjuan Liu, Weizhen Zhang, Jianyu Hao
Journal of Inflammation Research.2022; Volume 15: 4409. CrossRef - Diabetic Ferroptosis and Pancreatic Cancer: Foe or Friend?
Le Li, Xing-jia Yu, Lei Gao, Long Cheng, Bei Sun, Gang Wang
Antioxidants & Redox Signaling.2022; 37(16-18): 1206. CrossRef - Melatonin Induces Apoptosis and Modulates Cyclin Expression and MAPK Phosphorylation in Pancreatic Stellate Cells Subjected to Hypoxia
Matias Estaras, Manuel R. Gonzalez-Portillo, Miguel Fernandez-Bermejo, Jose M. Mateos, Daniel Vara, Gerardo Blanco-Fernandez, Diego Lopez-Guerra, Vicente Roncero, Gines M. Salido, Antonio González
International Journal of Molecular Sciences.2021; 22(11): 5555. CrossRef - Integrated pancreatic microcirculatory profiles of streptozotocin‐induced and insulin‐administrated type 1 diabetes mellitus
Yuan Li, Bingwei Li, Bing Wang, Mingming Liu, Xiaoyan Zhang, Ailing Li, Jian Zhang, Honggang Zhang, Ruijuan Xiu
Microcirculation.2021;[Epub] CrossRef - Pancreatic stellate cells - rising stars in pancreatic pathologies
P Hrabák, M Kalousová, T Krechler, T Zima
Physiological Research.2021; (S4): S597. CrossRef
 PubReader
 ePub Link
 Cite
Cite