Prevalence of Type 2 Diabetes and Impaired Glucose Regulation with Associated Cardiometabolic Risk Factors and Depression in an Urbanizing Rural Community in Bangladesh: A Population-Based Cross-Sectional Study
Article information
Abstract
Background
To determine the prevalence of type 2 diabetes (T2DM) and impaired glucose regulation (impaired fasting glucose [IFG] and impaired glucose tolerance [IGT]) in an urbanizing rural population of Bangladesh and associated cardiometabolic risk indicators and depression.
Methods
A total of 2,293 subjects aged ≥20 years in an urbanizing rural Bangladeshi community were investigated. Socio-demographic and anthropometric details, blood pressure, fasting plasma glucose (FPG), 2 hours after 75 g plasma glucose (2hPG), glycosylated hemoglobin, fasting serum insulin and lipid profiles were studied. Presence of depressive symptoms using Montogomery-Asberg Depression Rating Scale was also assessed.
Results
The prevalence of IFG, IGT, IFG+IGT, and T2DM were 3.4%, 4.0%, 1.2%, and 7.9%, respectively. The prevalence of T2DM and impaired glucose regulation differed between males and females, but, both increased with age in both sexes. FPG and 2hPG had positive correlation. Employing logistic regression, it was found that increased age, waist to hip ratio, systolic blood pressure, total cholesterol, triglycerides, and depression were independent risk indicators for diabetes. Both insulin resistance and β-cell deficiency were significantly related for causation of diabetes. Among the study population, 26.2% had general obesity, 39.8% central obesity, 15.5% hypertension, 28.7% dyslipidemia, 17.6% family history of diabetes, and 15.3% had depression. Physical inactivity and smoking habits were significantly higher in male.
Conclusion
Rising prevalence of diabetes and impaired glucose regulation in this urbanizing rural population exist as a significant but hidden public health problem. Depression and other cardiometabolic risk indicators including obesity, hypertension, and dyslipdemia were also prevalent in this population.
INTRODUCTION
Diabetes (DM) is a crucial health issue that affects 285 million people worldwide, including 5.7 million people residing in the Bangladesh [1]. Annually diabetes is responsible for 5% of all deaths globally, and its prevalence is increasing steadily [2]. According to the International Diabetes Federation, the number of people living with DM is projected to reach 438 million by 2030 [1]. It has been estimated that among the 10 leading countries in terms of the number of people with DM in the year 2030, five are in Asia. Bangladesh will rank as the 8th highest diabetic populous country in this time period [1]. Because of its widespread prevalence and potentially debilitating impact, DM has become an international and national priority area of health concern [2]. Although the importance of addressing DM is well recognized, translating clinical, evidence-based management interventions for practical implementation has proven difficult, particularly for rural communities in the developing world [3,4]. Individuals living in rural communities often encounter difficulties obtaining appropriate health care because of distance from health clinics, financial limitations, cultural barriers, misbelieves, communication issues, and high rates of health illiteracy.
Bangladesh is an agro-based rural country where a vast majority (72%) of the national population lives in rural areas [5]. Like other developing countries Bangladesh has undergone marked economic and epidemiologic transition in recent years. Increasing urbanization has been founded with a sedentary lifestyle, higher calorie food intake and stressful condition, which might have contributed to the increasing prevalence of DM and impaired glucose regulation [6,7].
It has been reported that prevalence of type 2 diabetes (T2DM) is more in urban people compare to rural people in Bangladesh and onset at a relatively young age and low body mass index (BMI) [8,9]. In rural Bangladesh, prevalence of diabetes and impaired fasting glucose (IFG) increased from 2.3% to 6.8% and 4.6% to 5.8% in between 1999 and 2004 [10]. Still population-based study of IGT prevalence in rural Bangladesh is not well documented. Only one population based study in 2004, impaired glucose tolerance (IGT) prevalence in rural Bangladesh was found 2.0% [10]. This result might not reflect the real picture as because in those previous studies, a 75 g oral glucose tolerance test (OGTT) could not be completely carried out for the diagnosis of DM and impaired glucose regulation. To the best of our knowledge no study has yet been conducted in the urbanizing rural population in Bangladesh to estimate the prevalence of various types' of glucose intolerance (i.e., T2DM, IFG, and IGT) following World Health Organization (WHO) criteria [11]. Therefore, the purpose of the study was to observe the prevalence of T2DM and impaired glucose regulation (IFG and IGT) in an urbanizing rural population of Bangladesh and their association with cardiometabolic risk indicators and depression. Using information on fasting and 2-hour plasma glucose, the prevalence of various categories of glucose intolerance in male and female was estimated by using WHO criteria. We also observe the etiological components of glucose intolerance by measuring the fasting insulin, homeostasis model assessment of insulin resistance (HOMA-IR) and β-cell deficiency (HOMA-B).
METHODS
Study area and population
This study was part of a large longitudinal epidemiological study on diabetes in rural Bangladesh which has been described previously [12]. The current cross-sectional study was carried out during March to December 2009 in an urbanizing rural community "Chandra" 40 km north of capital Dhaka city. Some structural changes occurred during the last 10 years due to territorial expansion of Dhaka city. The region can now be considered as semi-urban as the dwellers have access to most of the basic urban facilities such as 100% sanitation, 95% safe water supply, 90% households electric supply and brick road communication. Substantial number of new small industries, garments factories, poultry farm and fisheries were established during last 10-year period. Ten villages were randomly selected from five areas with a population of approximately 20,000 with aged ≥20 years. For this study, 3,000 individuals were randomly selected and among them 2,376 (79.2%) participated. The present analysis is based on 2,293 participants (842 male and 1,451 female) for whom all the variables were available. Exclusion criteria included pregnant women, and those with a diagnosed acute physical or mental illness.
Diabetes survey and data collection
Once selection procedure was completed, participants were requested to visit a nearby field center after an overnight fast of 8 to 12 hours. Then 8 mL of venous blood was collected from each participant. Fasting plasma glucose (FPG), lipid profile, serum insulin, and glycosylated hemoglobin (HbA1c) were determined from fasting blood sample. All subjects other than those with known DM (n=40) were then given a 75 g oral glucose solution (75 g oral glucose in 250 mL of water) to drink. Another 3 mL of venous blood was collected after 2 hours to determine 2 hour post OGTT. The samples for plasma glucose test were collected in a tube containing sodium fluoride and potassium oxalate (1:3) and were centrifuge immediately after collection. Separated plasma samples were sent to laboratory of Bangladesh Institute of Research and Rehabilitation for Diabetes, Endocrine and Metabolic Disorders (BIRDEM) in ice jell packed cooling boxes and stored at -70℃ until laboratory assays was done. Plasma glucose was measured by the glucose oxidase method using Dimalesion RxL Max (Japan) on the same day. Quality control on the blood glucose measurement was checked by measuring the 2-hour plasma glucose values using the glucose oxidase methods in every 10th case. The intra-assay coefficient of variation was 1.24% at a mean of 5.86 mmol/L, and the inter-assay coefficient of variation was 2.10% at a mean of 5.23 mmol/L. HbA1c estimated by high performance liquid chromatography. Insulin was measured later on by a two-site chemiluminescent immunoassay system (Diagnostic Products Co., Los Angeles, CA, USA). We calculated HOMA-IR and HOMA-B using the method of Matthews et al. [13]. Fasting serum lipid profile was estimated by standard enzymatic procedures (Dimalesion RxL Max). High density lipoprotein cholesterol (HDL-C) was estimated by the direct assay method and low density lipoprotein cholesterol (LDL-C) was estimated by Friedewald's formula. Cutoff values for serum lipid profiles were as follows: cholesterol ≥5.0 mmol/L, triglycerides (TG) ≥1.7 mmol/L, LDL ≥3.0 mmol/L, and HDL-C <1.03 mmol/L (for male) and <1.29 mmol/L (for female). Dyslipidemia was defined as TG ≥1.7 mmol/L and HDL-C <1.03 mmol/L (for male) and <1.29 mmol/L (for female).
Diagnosis of various degree of glucose intolerance: T2DM, IFG, IGT, and combine IFG+IGT
Diabetes was diagnosed if FPG value was ≥7.0 mmol/L and/or 2-hour post plasma glucose (2hPG) was ≥11.1 mmol/L. IFG was defined if FPG was between 6.1 and <7 mmol/L and 2hPG was <7.8 mmol/L. IGT was defined if FPG was <6.1 mmol/L and 2hPG was between ≥7.8 and <11.1 mmol/L. Combine IFG and IGT was defined if FPG values was between 6.1 and <7 mmol/L and 2hPG was between ≥7.8 and <11.1 mmol/L. For screening of IFG, IGT, and T2DM, diagnostic criteria of WHO was used [11].
Interview
During the 2-hour waiting period for OGTT, the respondents were interviewed for socio-demographic information's. Information's were collected using a pretested questionnaire and their anthropometric measurements including height, weight, hip and waist girth were recorded. Measurements of height, weight, and waist and hip circumference were taken with light clothes without shoes. For height, the subject stood in erect posture vertically touching the occiput, back, hip and heels on the wall while gazing horizontally in front and keeping the tragus and lateral orbital margin in the same horizontal plane. Waist circumference was measured by placing a plastic tape horizontally midway between 12th rib and iliac crest on the mid-axillary line. Similarly, hip was measured by taking the extreme end posteriorly and the symphysis pubis anteriorly. Cutoff values for general obesity for both sexes were a BMI of ≥25 kg/m2, cutoff values for central obesity including waist circumference for male and women were ≥90 and ≥80 cm, respectively, and waist to hip ratio (WHR) for male ≥0.90 and female for ≥0.80 [14,15]. In addition, blood pressure was measured in both sitting and standing position. Prior to the measurement, 10-minute rest was assured and using standard cuffs for adults fitted with sphygmomanometer minimized variation in measurement. Two readings were taken 5 minutes apart, and the mean of the two was taken as the final blood pressure reading of the individual. Hypertension was defined as a systolic blood pressure (SBP) of 140 mm Hg and/or diastolic blood pressure (DBP) of 90 mm Hg or current treatment with antihypertensive medication [16]. Physical activity was graded on the ordinal scale of 1 to 3, corresponding to light, moderate and heavy, according to the activity level of study population. For the purpose of data analysis, these results were transformed into a binary variable-inactive (grade 1) and active (grade 2 and 3). Smoking habit was classified as either current or non/ex-smoker. Montogomery-Asberg Depression Rating Scale (MADRS) [17] was used for the assessment of depression scores. The questionnaire was translated into local language Bangla by the first author. Fieldworkers, who had received one week training in using this questionnaire prior to the survey, filled it out. The score of each item can range from 0 to 6; hence, the sum for the 10 items can range from 0 to 60. In general, MADRS scores are categorized in four groups: 0 to 12 (healthy), 13 to 19 (mild depression), 20 to 34 (moderate depression), and 35 to 60 (severe depression) [17]. Based to previous experiences [18] and limited samples it was decided to use only two groups 0 to 12 (healthy subjects) and ≥13 (depressed subjects).
Ethics
The protocol was approved both by Norwegian and Ethical Review Committee of Diabetic Association of Bangladesh. Verbal consent was received from all subjects prior to inclusion in the study. The procedure was adopted in order to avoid selection bias. Verbal orientation of the objectives and the procedure were read aloud to the subjects, including their right to refuse and withdraw at any stage of the study or to bar their data from analyses. All information and data collected were deemed confidential. All patients received a hardcopy of their own biochemical results.
Statistical analysis
All the continuous variables were presented as mean (95% confidence interval) or geometric mean (95% confidence interval) and categorical data as percentage (95% confidence interval). Highly skewed variables (HbA1c, TG, insulin, HOMA-B, and HOMA-IR) were log transformed before analysis. Age specific and age standardized prevalence by direct standardization method were estimated on the basis of 2001 census data before performing statistical tests [19]. Differences between the two groups of means adjusted for age were tested by analysis of covariance (ANCOVA) and pairwise comparisons between the groups were performed and corrected for multiple testing using Bonferroni method. Logistic regression models were used to examine the statistical difference of proportions and estimate the odd ratios adjusted for age and potential confounding factors. Measure of association between two continuous variables and two categorical variables were tested by Pearson's and Spearman's correlation coefficient, respectively. Kappa was used to evaluate the agreement between FPG and 2hPG. Multiple logistic regression analyses were also used to study the association of risk variables with T2DM and impaired glucose regulation. Two-sided P values were given and compared with significance level 0.05. The estimation of standardized prevalence was performed with STATA 11 for Windows (StataCorp, College Station, TX, USA) and the other analyses were carried out with PASW 18 for Windows (SPSS Inc., Chicago, IL, USA).
RESULTS
The age standardized prevalence of IFG, IGT, IFG+IGT, and T2DM were 3.4%, 4.0%, 1.2%, and 7.9%, respectively. IFG, IFG+IGT, and T2DM were more prevalent in male while IGT was same in both sexes. In age standardized prevalence, only IFG group (4.6% in male and 2.7% in female; P<0.05) showed significant sex difference. The age specific prevalence of T2DM, IFG, and IGT showed an increasing trend with increasing age. The trends were statistically significance for T2DM of both sexes and overall IFG (Table 1).

Age-specific and age standardized prevalence of different categories of glucose tolerance in 842 male and 1,451 female
The prevalence of general and central obesity were 26.2%, 39.8% (increased waist circumference), and 71.6% (increased WHR), respectively. Both general and central obesity were observed higher in the IFG+IGT group than other groups of glucose intolerance. Sex differences for both form of central obesity were found in subjects with T2DM and IFG group. Among the study people, 15.5%, 28.7%, and 15.3% had hypertension, dyslipidemia, and depression, respectively. Prevalence of hypertension, dyslipidemia, and depression were found higher in subjects with T2DM of both sexes than other groups of glucose intolerance. Physical inactivity and smoking habits were also found higher in subjects with T2DM and significantly high in male in all groups. Except IGT group, no statistically significant sex related differences were observed in other groups for family history of diabetes (Table 2).

Prevalence of subjects with varying degrees of glucose tolerance with associated cardiometabolic risk factors, by sex
Statistically difference between the two sexes in the mean age was found in normal glucose tolerance (NGT) and T2DM. BMI, WHR, and waist circumference were higher in the glucose intolerant groups than in the NGT group, while the highest mean values were found in the IFG+IGT group for both sexes. WHR was higher among males in all groups. Waist circumference was higher in male compare to female groups. SBP was found higher in IGT and T2DM of both sexes, while statistically significant sex difference had found in NGT and IFG+IGT groups in DBP. Lower level of HDL was found in IFG and IGT group and only significant sex difference of total cholesterol (TC) and LDL were found in IGT (P<0.05). Male had higher FPG and HbA1c levels where as 2hPG was more in female. FPG and 2hPG values were positively correlated in NGT and T2DM subjects. Fasting serum insulin was higher in IFG+IGT of both sexes. People with diabetes had less HOMA-B and higher HOMA-IR level in compare to other groups. Both HOMA-B and HOMA-IR were significantly correlated (Spearman correlation) with T2DM in both sexes (HOMA-B: male, -0.111, P<0.0013, female, -0.125, P<0.001; and HOMA-IR: male, 0.324, P<0.001, female, 0.289, P<0.001, respectively) after adjusting age (Table 3).
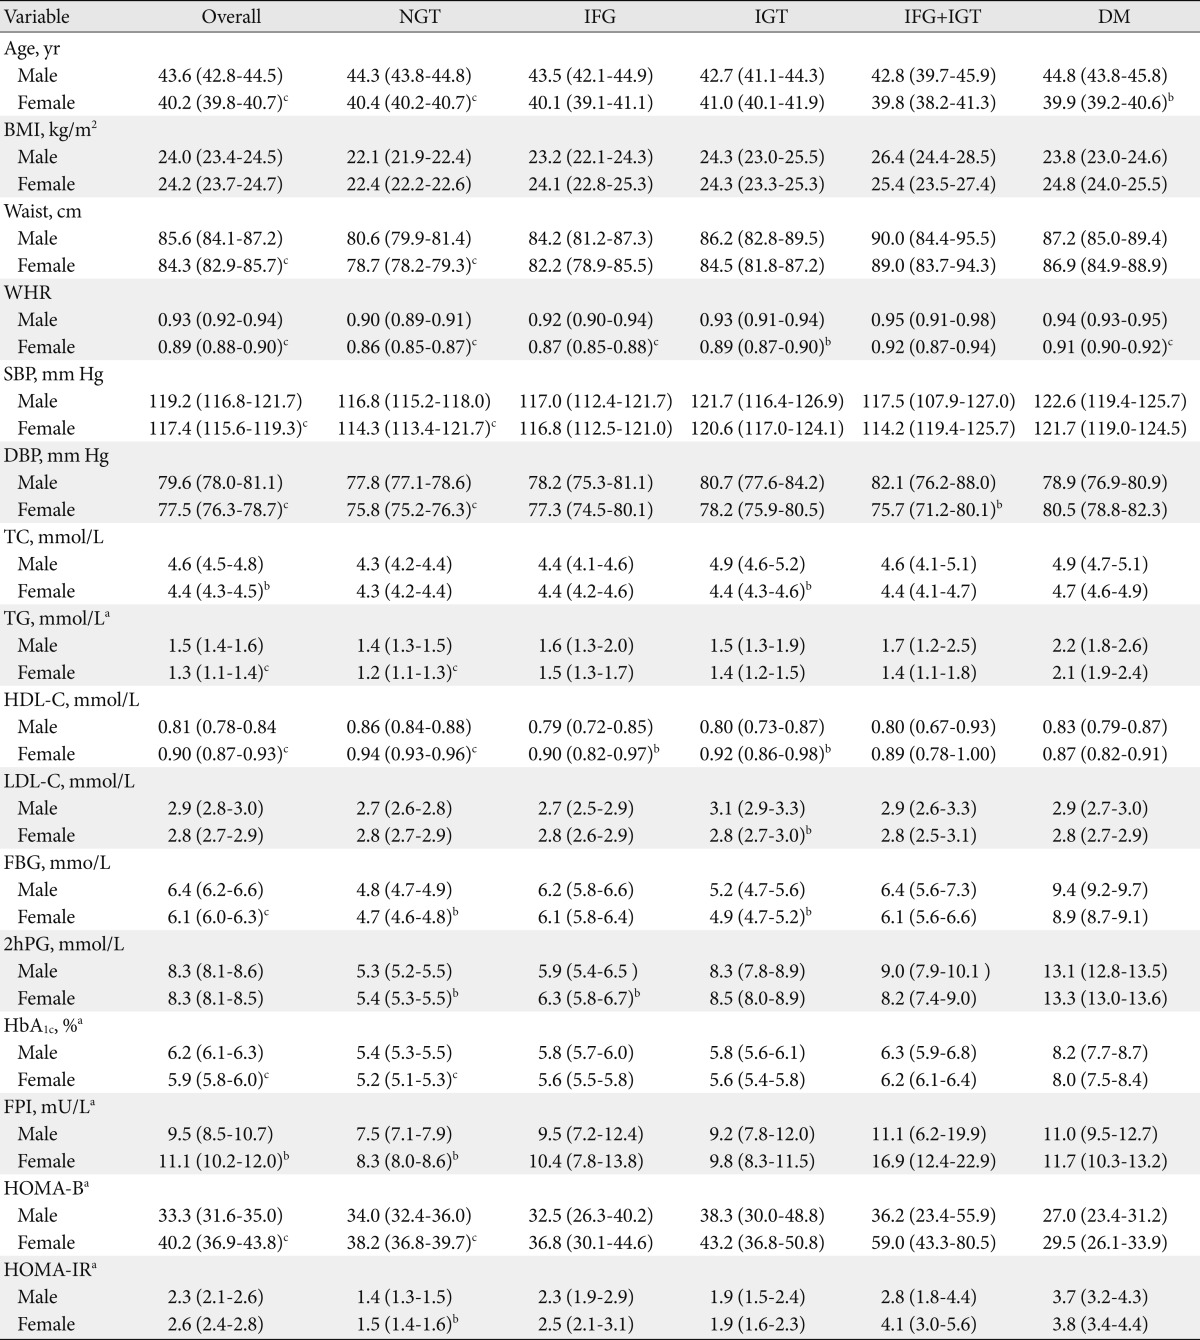
Clinical and biochemical characteristics of the subjects with varying degrees of glucose tolerance, by sex
With the fasting criterion of ≥7.0 mmol/L alone, 6.7% (n=153) diagnosed diabetic and 6.0% (n=137) diagnosed diabetic following 2hPG of ≥11.1 mmol/L. Among the subjects with FPG value of 6.1 to <7.0 mmol/L, 65.3% turned out to have NGT, 22.3% had IGT, and 12.4% were diabetic as assessed by the 2hPG values. Among the 153 diabetic subjects, 109 subjects satisfied 2hPG values of ≥11.1 mmol/L and only 44 subjects satisfied the FPG criterion for diagnosis of DM (i.e., FPG ≥7.0 mmol/L). A moderate agreement (Kappa 0.520) was observe between FPG and 2hPG (Table 4).
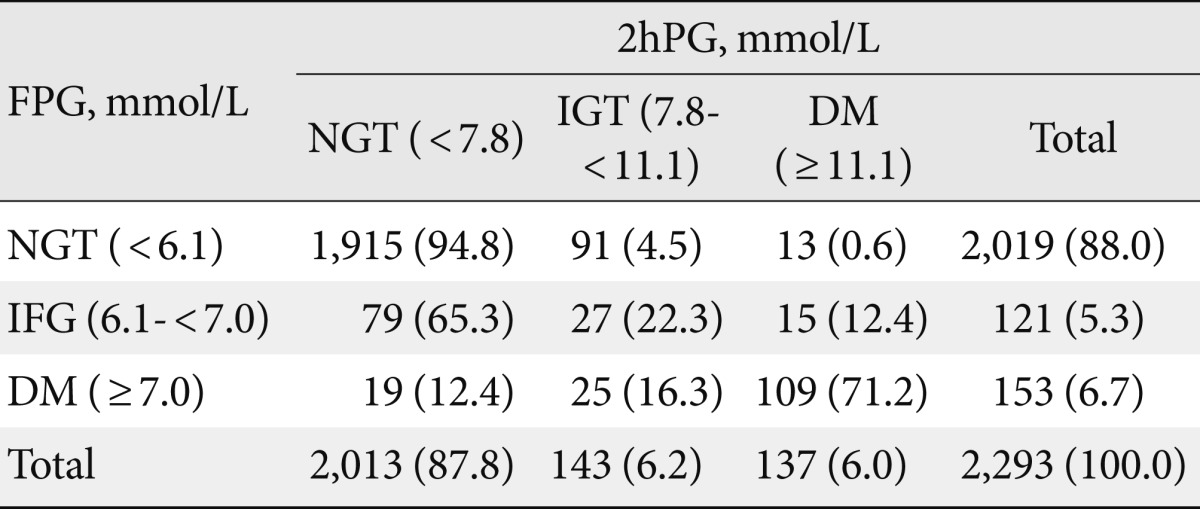
Prevalence of categories of glucose tolerance according to FPG and 2hPG diagnostic criteria for the rural Bangladeshi population
Increasing age, WHR, SBP, TC, TG, and depression were significant risk indicators for the development of diabetes and on the other hand age, TG, HDL-C, and depression were significant risk indicators for the development of impaired glucose regulations in multivariate analysis after adjusting for a number of potential confounding factors. We did not found any significant association of BMI, socio-economic condition, education level, family history of diabetes, smoking habits, and physical inactivity as risk indicator for diabetes and impaired glucose regulation (Table 5).

Adjusted OR and 95% CI of diabetes and impaired glucose regulation (IFG or IGT or both) by the following characteristics
DISCUSSION
This population-based study demonstrated a continued high prevalence of T2DM, IFG, and IGT in urbanizing rural Bangladesh consistent with previous study [10]. Like the former study this study results also showed that the prevalence of IGT was slightly higher than that of IFG [10,20]. The prevalence of IFG and T2DM were significantly higher in males but no such sex difference was observed for IGT and IFG+IGT cases. Male had higher prevalence of DM in all age groups compared with female subjects in our study. The difference in prevalence by sex widened in the older age strata. However, earlier data had shown a higher prevalence of DM among female subjects [20, 21]. Gender difference was not significant in India [22], though non-significant higher prevalence of T2DM was found among women in another investigation in India [7]. Higher prevalence of DM in women was also reported from Turkey and Pakistan [23,24].
Studies conducted in Mauritius [25], and Pima Indians in United States [26] observed more IGT prevalence compared to IFG [27]. However, studies conducted in the Netherlands [28], Finland [29], India [30], and among Asian Americans [31] did not find any difference in the prevalence of IFG and IGT.
The findings of this study showed that when FPG ≥7.0 mmol/L was used as the diagnostic criterion, the prevalence of diabetes was 6.7%, whereas it was 6.0% when the 2hPG values (≥11.1 mmol/L) were used. This finding is also consistent with previous studies in Bangladesh although they used different cut values and methods [10]. This finding is an agreement with an Indian study where the prevalence of diabetes was 5.2% according to the FPG criteria and 4.3% according to 2hPG threshold [32] but opposite to an Australian study [33]. Furthermore, data showed a good agreement between the two procedures (FPG and 2hPG) for the identification of diabetic cases. Concern has been expressed that IFG might not identify the same subjects as IGT [32]. However, the prevalence of glucose intolerance by either procedure was similar (by FPG [IFG+T2DM] was 12.0% or 2hPG [IGT+T2DM] was 12.2%). Given the higher prevalence of IFG and IGT, it can be reasonably being expected that the prevalence of diabetes will continue to increase in this population in near future.
Study found higher BMI, waist and WHR among subjects with impaired glucose regulation and it was consistence with previous two studies conducted in this population [10,21]. In this study, both β-cell dysfunction (decrease insulin secretion) and insulin resistance (unusual expression) were more in diabetic as compared to normal individuals. In T2DM cases loss of insulin sensitivity was significant in both sexes which was just opposite to previous studies conducted in Bangladesh in different time point where insulin secretory defect had contributed more to the development of T2DM [34,35]. Observation of this study is more consistent with those of western population where insulin resistance is thought to be the predominant defect in T2DM [36,37]. Increased environmental influences like urbanization, physical inactivity, obesity and stress might be the most probable reason for this difference.
Another main issue in the present survey was the risk indicators that affected the development of DM. The present data showed that age, WHR, SBP, TC, TG and depression were variables that could predict the development of DM. In the present study, it was confirmed that the WHR, a measure indicative of central obesity, is a major risk indicator of DM which was also evident in previous studies in Bangladesh [12]. Despite the fact that Asians have lower BMI than Western counterparts, some Asian countries have a similar or even higher prevalence of diabetes than Western countries. This finding is explained by the observation that Asian populations are more prone to abdominal obesity with increased insulin resistance compared with their Western counterparts. Therefore, central obesity is a useful marker as a risk of T2DM, especially in individuals with normal BMI values [38].
The study found association of increased TC and TG with T2DM and increased TG and lower HDL with impaired glucose regulation. But these associations were contradictory to an earlier rural study [9] though we got identical result in an urban study [35]. These results indicate that dyslipidemia which is common in T2DM may start earlier, i.e., in prediabetic condition, even before the onset of DM. In accordance with previous studies, SBP was significant predictor of DM [20,39]. Family history of DM, physical inactivity and smoking habit were not significantly associated with DM or impaired glucose regulation in this study. However, positive association was reported in a previous rural Bangladeshi study [9]. Confounding effects of age, gender, and occupation on the activity level might be the possible explanation of non-significant association of physical inactivity with DM in this study population.
Along with the conventional risk indicator this study found significant association of depression with DM (odds ratio, 3.52; P<0.001) and impaired glucose regulation (odds ratio, 2.44; P<0.001) in our urbanizing rural population. Study findings are consistence with the previous findings [40]. Along with the previous findings this study data emphasis that depressive symptoms in this culture are common, especially in those with diabetes. Psychotherapy may be necessary in addition to lifestyle changes to prevent the exponential increase in the occurrence of T2DM. In addition, a common approach including psychiatric treatment in diabetes care may be necessary to achieve improved glycaemic control in this population.
The strength of the study was that it was a population based cross-sectional study to find the prevalence of subjects with varying degrees of glucose tolerance with associated cardiometabolic risk factors in an urbanizing rural area. So far this was one of the recent studies reported from the urbanizing rural population in Bangladesh. Bias was taken care of by random sampling.
The limitation of the study was that, the prevalence among adolescents was not included. The increase prevalence in the present report is not likely to be the true prevalence of diabetes in overall urbanizing rural population of Bangladesh. The study area was selected purposively as a semi-urban, 40 km far from Dhaka and the sample size was not so large as to represent the real picture of the country burden of diabetes.
In conclusion, the higher prevalence in the present study indicates the environmental factors may encompass a strong role for the rising prevalence of diabetes in urbanizing rural population in a developing country like Bangladesh. So, from this study it can be concluded that major cardiometabolic risk factors like hypertension, dyslipidaemia, central obesity (WHR) and insulin resistance associated with depression arise before the onset of diabetes, i.e., in prediabetic condition which is also associated with diabetes and cardiovascular diseases. If the risk factors of prediabetic subjects can be diagnosed earlier, it will be easier to prevent diabetes in a resource constraint country like Bangladesh. This study further recommends a longitudinal study to demonstrate the importance of modifying risk indicator for the development of DM and reducing its prevalence in Bangladeshi population.
ACKNOWLEDGMENTS
We acknowledge the contribution of our survey team members, the village leaders and volunteers for their continuous effort in the collection of data. We are grateful to all participants in the study for their active co-operation. We also express our admiration to the authority of Diabetic Association of Bangladesh for providing us with local logistic support and University of Oslo for their financial support.
Notes
No potential conflict of interest relevant to this article was reported.