- Current
- Browse
- Collections
-
For contributors
- For Authors
- Instructions to authors
- Article processing charge
- e-submission
- For Reviewers
- Instructions for reviewers
- How to become a reviewer
- Best reviewers
- For Readers
- Readership
- Subscription
- Permission guidelines
- About
- Editorial policy
Articles
- Page Path
- HOME > Diabetes Metab J > Volume 45(1); 2021 > Article
-
Original ArticleBasic Research Notch1 Has an Important Role in β-Cell Mass Determination and Development of Diabetes
-
Young Sil Eom1
 , A-Ryeong Gwon2, Kyung Min Kwak2, Jin-Young Youn3, Heekyoung Park2, Kwang-Won Kim2, Byung-Joon Kim1
 -
Diabetes & Metabolism Journal 2021;45(1):86-96.
DOI: https://doi.org/10.4093/dmj.2019.0160
Published online: February 26, 2020
1Department of Internal Medicine, Gachon University Gil Medical Center, Gachon University College of Medicine, Incheon, Korea
2Department of Internal Medicine, Gachon University Gil Medical Center, Incheon, Korea
3Institute of Clinical Medicine, Gachon University Gil Medical Center, Incheon, Korea
-
Corresponding author: Byung-Joon Kim Division of Endocrinology and Metabolism, Department of Internal Medicine, Gachon University Gil Medical Center, Gachon University College of Medicine, 21 Namdong-daero 774beon-gil, Namdong-gu, Incheon 21565, Korea. kbjoon4u@gilhospital.com
Copyright © 2021 Korean Diabetes Association
This is an Open Access article distributed under the terms of the Creative Commons Attribution Non-Commercial License (http://creativecommons.org/licenses/by-nc/4.0/) which permits unrestricted non-commercial use, distribution, and reproduction in any medium, provided the original work is properly cited.
ABSTRACT
-
Background
- Notch signaling pathway plays an important role in regulating pancreatic endocrine and exocrine cell fate during pancreas development. Notch signaling is also expressed in adult pancreas. There are few studies on the effect of Notch on adult pancreas. Here, we investigated the role of Notch in islet mass and glucose homeostasis in adult pancreas using Notch1 antisense transgenic (NAS).
-
Methods
- Western blot analysis was performed for the liver of 8-week-old male NAS mice. We also conducted an intraperitoneal glucose tolerance test (IPGTT) and intraperitoneal insulin tolerance test in 8-week-old male NAS mice and male C57BL/6 mice (control). Morphologic observation of pancreatic islet and β-cell was conducted in two groups. Insulin secretion capacity in islets was measured by glucose-stimulated insulin secretion (GSIS) and perifusion.
-
Results
- NAS mice showed higher glucose levels and lower insulin secretion in IPGTT than the control mice. There was no significant difference in insulin resistance. Total islet and β-cell masses were decreased in NAS mice. The number of large islets (≥250 µm) decreased while that of small islets (<250 µm) increased. Reduced insulin secretion was observed in GSIS and perifusion. Neurogenin3, neurogenic differentiation, and MAF bZIP transcription factor A levels increased in NAS mice.
-
Conclusion
- Our study provides that Notch1 inhibition decreased insulin secretion and decreased islet and β-cell masses. It is thought that Notch1 inhibition suppresses islet proliferation and induces differentiation of small islets. In conclusion, Notch signaling pathway may play an important role in β-cell mass determination and diabetes.
- Diabetes mellitus is one of the most common diseases and health problem in the 21st century with an increasing prevalence worldwide. It is caused by the absolute or relative deficiency of insulin. Insulin is released by pancreatic β-cells at an appropriate rate in response to blood glucose levels [123]. The causes of β-cell mass reduction are autoimmune destruction in type 1 diabetes mellitus (T1DM) and factors including insulin resistance, glucotoxicity, lipotoxicity, islet amyloid and so on in type 2 diabetes mellitus. It is believed that 70% to 90% of the β-cell mass and function is lost at the time of the clinical onset of T1DM [2]. Preserving or increasing the amount and function of β-cell is important in the treatment of diabetes [4].
- The endocrine cells of the pancreas are derived from pancreatic progenitor cells which are located within the early gut endoderm [5]. Various transcription factors are involved in differentiation of the pancreas, whthin which Notch signaling has an influence on regulating pancreatic endocrine and exocrine cell fate [67].
- Notch signaling pathway is complex and involve four Notch receptors (Notch1–4) and five ligands (Delta1, 3 and 4, and Jagged1 and 2) in mammals and is activated by ligand-receptor interactions between two neighboring cells [8]. Notch signaling is a conserved intracellular signaling mechanism and has important roles in embryonic development and in the maintenance of the homeostasis of multicellular organisms in adults. The loss of Notch signaling in mammals induces defects in embryonic development and tissue homeostasis, and the functional abnormality of Notch signaling is related to multiple developmental disorders and several inherited human diseases such as Alagille syndrome, spndylocostal dysostosis, and so on [89]. The Notch signaling pathway also plays a critical role in vascular development and homeostasis. Some studies have shown that Notch or Notch ligand knockout mice died from hemorrhage early during embryogenesis. or displayed severe defects in angiogenic vascular remodeling [1011]. Notch1 antisense transgenic (NAS) mice can be used instead of Notch or Notch ligand knockout mice. NAS mice were generated using a Notch1 antisense construct expressed under the control of the mouse mammary tumor virus long terminal repeat promoter and their genetic background is C57BL/6. NAS mice experience about 50% down-regulation of Notch-1 expression and function [1213].
- Notch signaling is still expressed in adult pancreas [814]. Notch is believed to maintain β-cell mass and have proliferative potency in adult pancreas [15]. A recent study has shown that Notch signaling regulates adult β-cell proliferation and maturity [15]. But there are few studies on the effect of Notch on adult pancreas still now.
- The objective of this study was to determine the effect of partial inhibition of Notch1 on glucose homeostasis and islet mass in the adult pancreas using NAS mice.
INTRODUCTION
- Animals
- NAS mice were generated as previously described [12]. Notch1 antisense construct has been described in previously detail [13] and has been shown to down-regulate Notch-1 expression and function in murine cells. Male C57BL/6 mice were supplied by Orient Bio Inc. (Seongnam, Korea). The animals were housed in animal facilities at the Lee Gil Ya Cancer and Diabetes Institute, Gachon University of Medicine and Science, under constant temperature (22℃ to 24℃) and humidity (40% to 60%) with a 12-hour light and 12-hour dark cycle. All animal experiments were carried out in accordance with the protocol approved by the Institutional Animal Care and Use Committee at Lee Gil Ya Cancer and Diabetes Institute, Gachon University (LCDI-2013-0037).
- Mouse tail genotyping
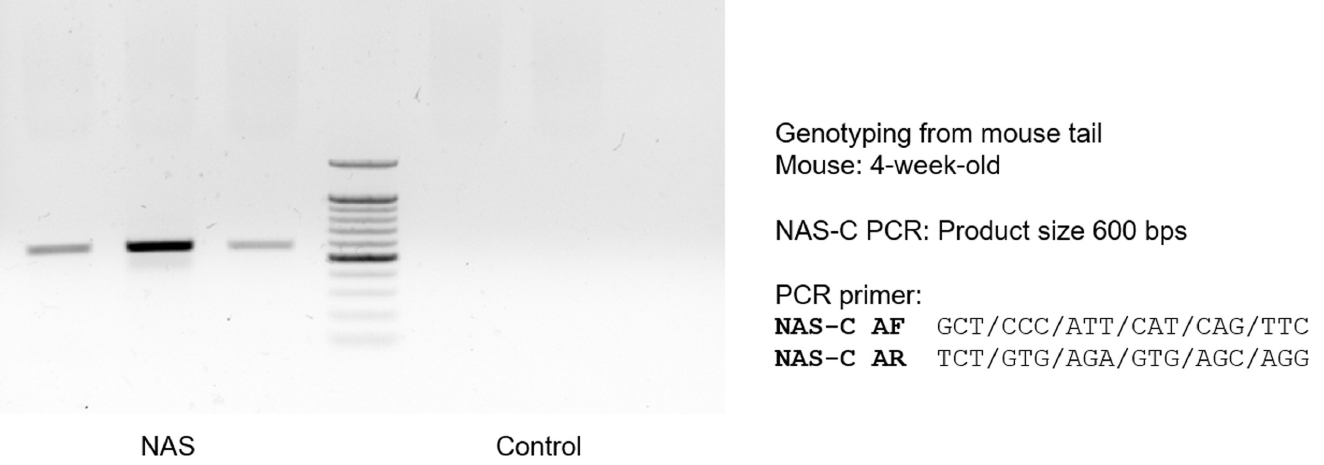
- Genomic DNA was extracted from the tail tissue of 4-week-old male NAS mice and purified. To confirm the genotype of the NAS mice, polymerase chain reaction (PCR) was performed using the primers described listed in Supplementary Table 1. The cycling profile used for genotyping was denaturation at the 95℃ for 5 minutes, then 35 cycles of 94℃ for 30 seconds, 54℃ for 30 seconds, 72℃ for 1 minute, and a final extension at 72℃ for 5 minutes.
- Notch protein expression in liver using western blot assay
- The livers were obtained from 8-week-old male control and NAS mice after having been sacrificed. Total liver proteins were separated by electrophoresis, blotted, and exposed first to antibodies against Notch1, 2, 3, and 4 (Santa Cruz Biotechnology, Santa Cruz, CA, USA), and then to a secondary antibody conjugated with horseradish peroxidase (HRP) (Sigma-Aldrich, St. Louis, MO, USA). The blots were revealed using enhanced chemiluminescence reagents (Pierce, Rockford, IL, USA), stripped, and exposed to an anti-β-actin antibody (Sigma-Aldrich).
- Measurements of body weight and blood glucose levels
- The body weight and casual blood glucose levels in 8-week-old male control and NAS mice (n=16 for each group) were measured using an OHAUS weighting balance (OHAUS Corporation, Shanghai, China), and a glucometer (OneTouch Ultra; Lifescan, Johnson & Jonson, Milpitas, CA, USA), respectively. Blood samples were obtained from the mice tail vein.
- Intraperitoneal glucose tolerance test and intraperitoneal insulin tolerance test
- For the glucose tolerance test, 8-week-old male NAS and control mice (n=16 for each group) were fasted overnight and glucose (2 g/kg; JW pharmaceutical, Seoul, Korea) was administered intraperitoneally. Blood samples were obtained from the mice tail vein at 0, 15, 30, 60, 90, and 120 minutes after glucose injection. Blood glucose levels were measured using a glucometer (OneTouch Ultra). The area under the curve (AUC) for the glucose was calculated over a 2-hour period of intraperitoneal glucose tolerance test (IPGTT). Serum insulin levels were measured at 0, 15, and 30 minutes using the ultrasensitive mouse insulin kit (Merck Millipore, Darmstadt, Germany). All insulin measurements were repeated three times. For the insulin tolerance test, animals were fasted overnight and human insulin (1 U/kg; Novonordisk, Bagsvaerd, Denmark) was injected intraperitoneally. Blood samples were obtained from the mice tail vein at 0, 15, 30, 60, 90, and 120 minutes after insulin injection. Blood glucose levels were measured using a glucometer (OneTouch Ultra).
- Islet staining: H&E staining, immunohistochemistry, and immunofluorescence
- The pancreas was fixed in 10% neutral buffered formalin, dehydrated, and paraffin-embedded. Multiple 3 µm thick microtome sections from the tissues were stained with hematoxylin and eosin (H&E). For the detection of insulin, paraffin sections were processed for immunohistochemistry (IHC) staining using the avidin-biotin peroxidase complex (ABC) method and diaminobenzidine (DAB)-nickel (Vector, Burlingame, CA, USA) reactions. Briefly, for insulin staining, the paraffin sections were incubated overnight with an antibody against insulin (rabbit polyclonal; Cell Signaling, Beverly, MA, USA) diluted 1:200 in 0.1% phosphate buffer saline (PBS) at room temperature (RT). After H&E and DAB, the images were observed using light microscope (×200, Imager Z1; Carl Zeiss, Berlin, Germany). For immunofluorescence (IF), the sections were deparaffinized, blocked and incubated overnight 4℃ with the primary antibodies for insulin, glucagon, and 4′,6-diamidino-2-phenylindole (DAPI) (Abcam, Cambridge, UK). After washing with PBS, the sections were incubated for 1 hour at RT with fluorescent secondary antibodies (Alexa Fluor 488 and 555, 1:500; Invitrogen, Carlsbad, CA, USA). The slides were counterstained with DAPI and mounted with Vectashield (Vector, Burlingme, CA, USA). Fluorescent images were obtained using a Zeiss LSM710 confocal microscope.
- Analysis of mass and number/area of islet and β-cell and α/β cell ratio
- Briefly, four random cross-sections of the pancreas were obtained. Islet diameter, area and number were measured by the H&E staining of sections. After insulin staining, the diameters and areas of β-cell within each section were measured by planimetry using the image tool for Windows, AxioVision re 4.7 (Carl Zeiss) as described above [1617181920]. Based on the median size, the islets were divided into two groups according to diameter (<250 µm vs. ≥250 µm), following which the islet number/4 mm2 was calculated. Islet size was classified as either small, medium, and large according to the area (small <0.003 mm2; medium 0.003 to 0.03 mm2; large >0.03 mm2). The ratio of α to β-cells was calculated according to islet size after counting α and β-cells in the IF sections using ImageJ (National Institutes of Health, Bethesda, MD, USA).
- Isolation and preparation of islets
- Pancreatic islets were isolated using the collagenase digestion method. Briefly, islets were isolated by intraductal injection of 0.8 mg/mL collagenase P (Roche, Mannheim, Germany) in Hank's buffered saline solution, purified using a Ficoll (Biochrom, Berlin, Germany) gradient, and cultured by suspension in RPMI 1640 (HyClone, South Logan, UT, USA) with 10% fetal bovine serum (Gibco, Grand Island, NY, USA) and 1% antibiotic-antimycotic (Gibco).
- Measurement of insulin secretion in islet: glucose-stimulated insulin secretion assay and perifusion assay
- To determine glucose-stimulated insulin release, 10 islets were washed using Kreb-Ringer buffer (115 mM NaCl, 4.7 mM KCl, 2.6 mM CaCl2, 1.2 mM KH2PO4, 1.2 mM MgSO4, 5 mM NaHCO3, 10 mM HEPES, 0.2% bovine serum albumin [BSA; pH 7.4]) containing 3.3 mmol/L glucose and preincubated with the same buffer for 1 hour. The buffer was replaced with fresh buffer for 1 hour, which was subsequently collected (basal) and replaced with a buffer containing 16.7 mmol/L glucose for an additional hour (glucose-stimulated). The supernatants were collected, and the concentration of the insulin was measured using a mouse/rat insulin enzyme-linked immunosorbent assay (ELISA) kit according to the manufacturer's instructions (Merck Millipore).
- To determine the oscillatory insulin secretion after an increase in glucose concentration (increased from 3.3 to 16.7 mmol/L, and then returned to 3.3 mmol/L), 50 islets were picked and loaded into a perifusion chamber at a flow rate of 0.5 mL/min in the apparatus described by Fujimoto and Metz [21]. For each perifusion experiment, islets were obtained from five mice. The five perifusion chambers each with a chamber volume of 0.25 mL were contained in a water jacket maintained at the same temperature. The temperature in the perifusion chamber was monitored using a thermistor which varied by no more than 1℃ over 120 minutes and demonstrated no periodicity. The protocol in each experiment was an initial 60 minutes equilibration period in 3.3 mmol/L glucose with either Krebs-Ringer Buffer containing 0.2% (wt/vol) BSA/V or 10 mM HEPES [22]. The medium was equilibrated with 95% O2 to 5% CO2 and maintained at a pH 7.4. Without interruption the flow, the islets were then perifused with the same medium containing 3.3 mmol/L glucose concentration 30 minutes, then 16.7 mmol/L glucose concentration for a period of 60 minutes. Before switching to the high glucose concentration, samples were collected in 5 minutes fractions and frozen for subsequent insulin analysis. After switching to 16.7 mmol/L glucose concentration, samples were collected in 2 minutes fraction for insulin measurement. Serum insulin levels were measured using a commercial ELISA kit (ALPCO Diagnostics, Windham, NH, USA).
- Quantitative real-time PCR analysis
- Total mRNA was isolated from mice islet using TRIzol reagent (Invitrogen). To obtain the complementary DNA (cDNA), equal amounts of total RNA were synthesized and used for quantitative fluorescent real-time PCR amplification. The sequences of primers are given in Supplementary Table 1.
- Statistical analysis
- All data are presented as the mean±standard deviation. All statistical analyses were performed using GraphPad Prism 7.0 (GraphPad Software Inc., San Diego, CA, USA). The statistical differences between groups were analyzed using unpaired Student's t-test. A P value of <0.05 was considered statistically significant.
METHODS
- Notch1 antisense construct is expressed in NAS mice
- To select mice for use in the experiment, mouse tail genotyping of Notch antisense construct was carried out in 4-week-old male NAS mice. Most NAS mice expressed Notch1 antisense construct in genotyping (Fig. 1). We selected the mice expressing the NAS antisense construct and used these animals in our study.
- Notch1 expression is decreased in NAS mice
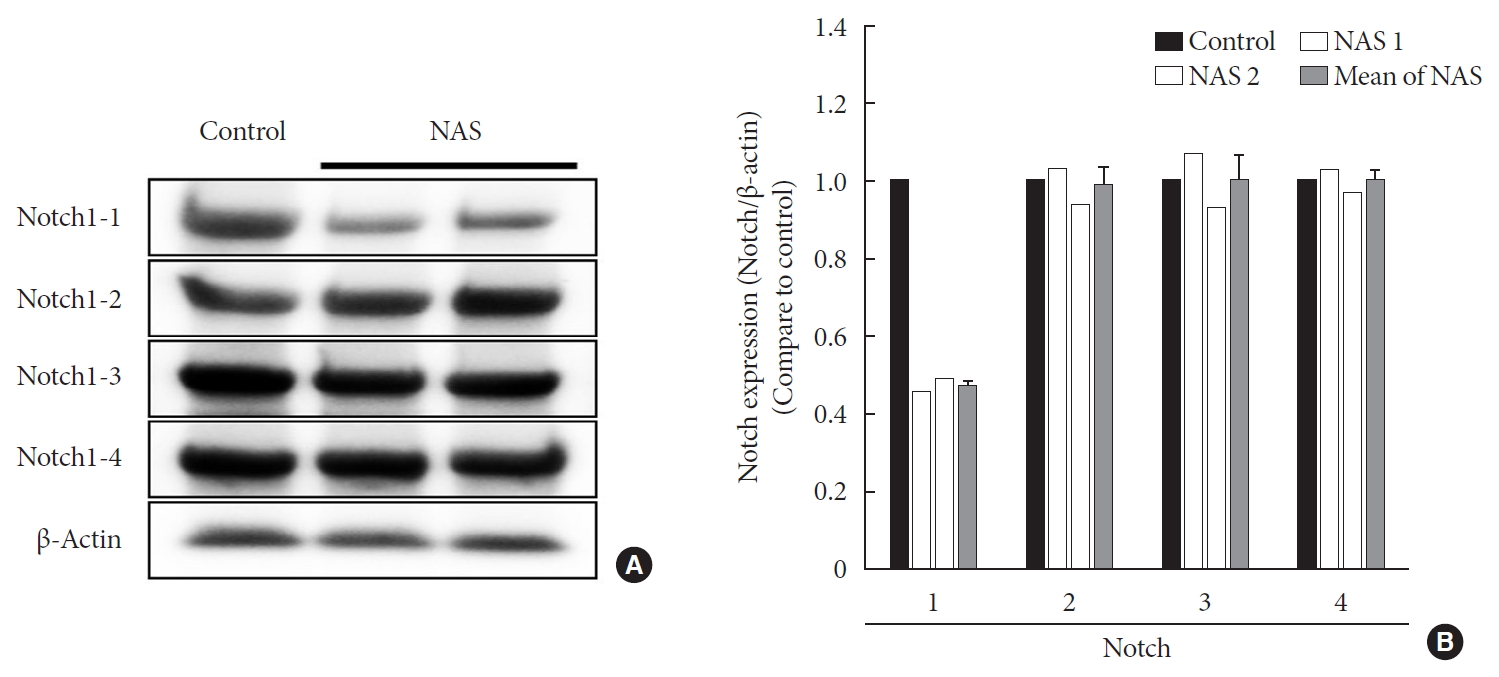
- To examine the tissue expression of Notch1 in NAS mice, Western blot analysis was performed for the liver. In all experiments, Notch1 expression was reduced by about 50% in NAS mice compared to the control mice. There was no difference in expression in Notch2, 3, and 4 between the two groups (Fig. 2).
- Inhibition of Notch1 decreases insulin secretion without changing of insulin resistance in NAS mice
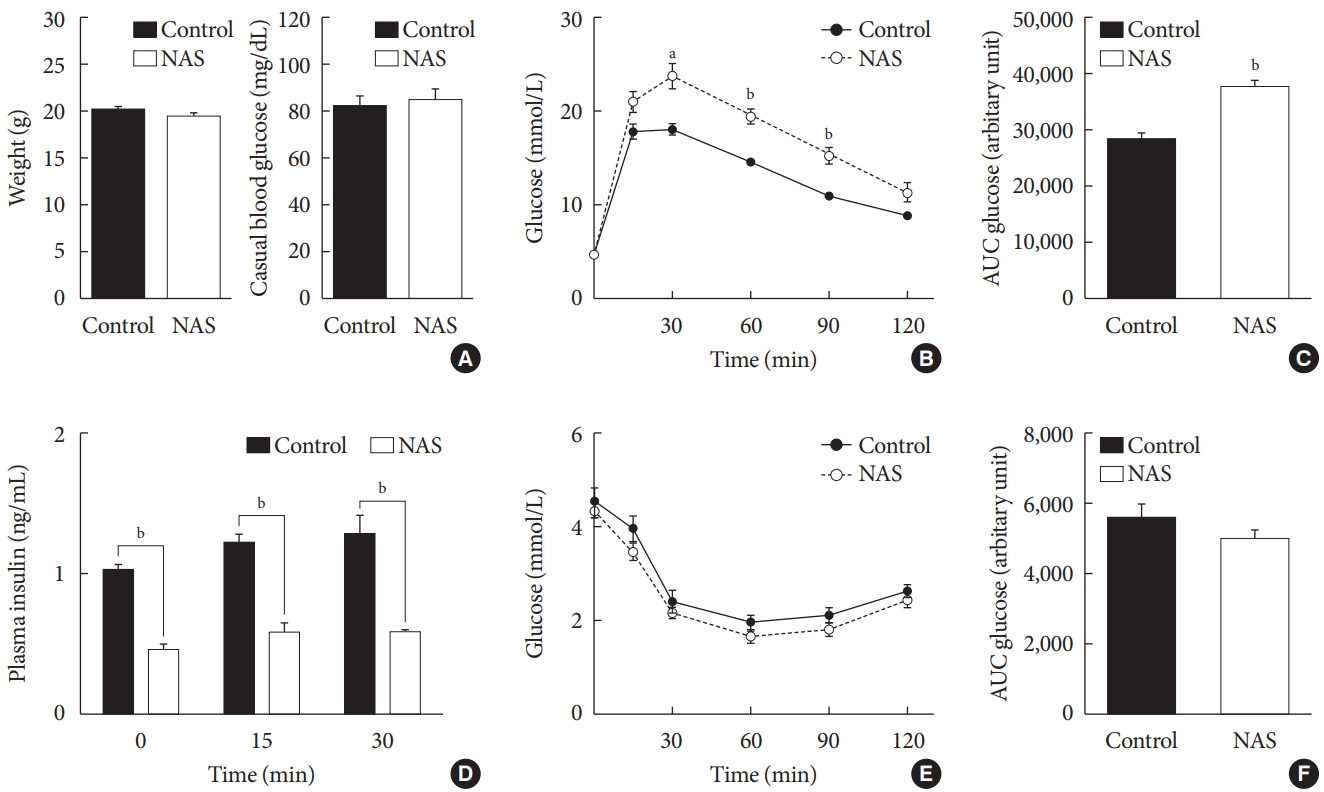
- There were no significant differences in the body weight and casual blood glucose levels between the two groups (Fig. 3A). To examine the effect of Notch1 on glucose homeostasis, we performed an IPGTT and an intraperitoneal insulin tolerance test (IPITT) on the 8-week-old male NAS mice and control mice. In the IPGTT, the glucose levels of NAS mice were significantly higher than those of the control mice at 30, 60, and 90 minutes (P<0.01, P<0.001, P<0.001, respectively) (Fig. 3B). The AUC of glucose showed significantly higher levels in the NAS mice compared to that in the control mice (P<0.001) (Fig. 3C). The serum insulin levels of NAS mice were significantly lower than those of the control mice at 0, 15, and 30 minutes (P<0.001, P<0.001, P<0.001, respectively) (Fig. 3D). In the IPITT, there was no significant difference in the glucose levels and the AUC between the two groups (Fig. 3E and F).
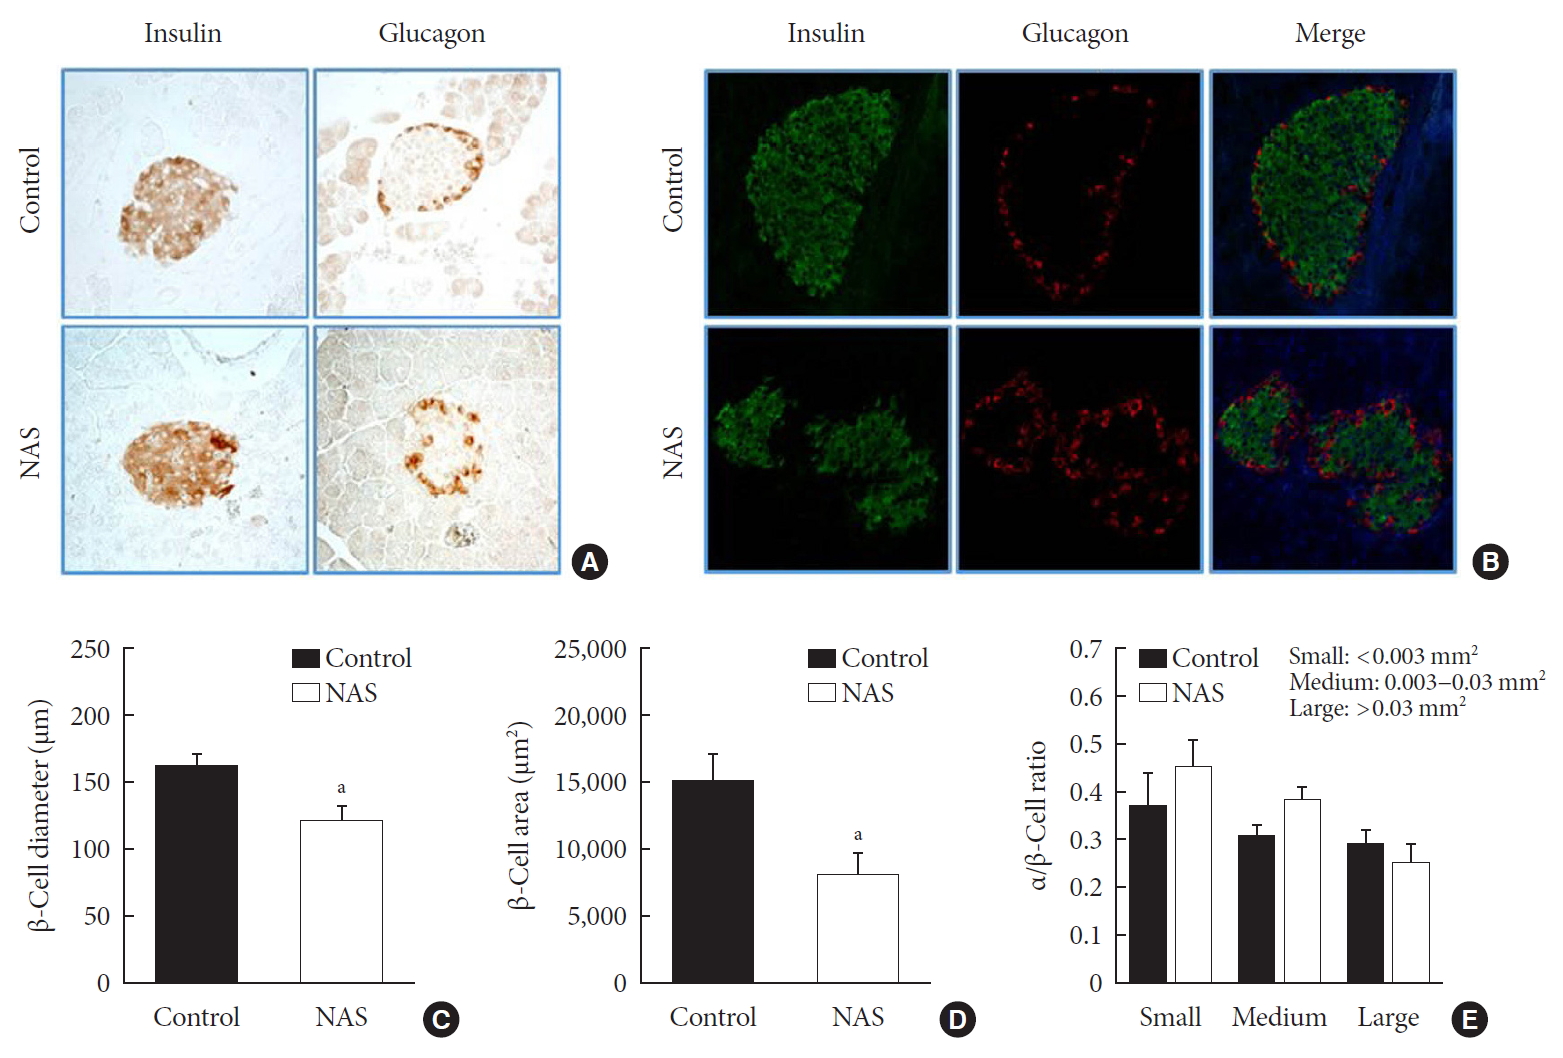
- Inhibition of Notch1 decreases islet mass and increases the numbers of small islets compared to large islets
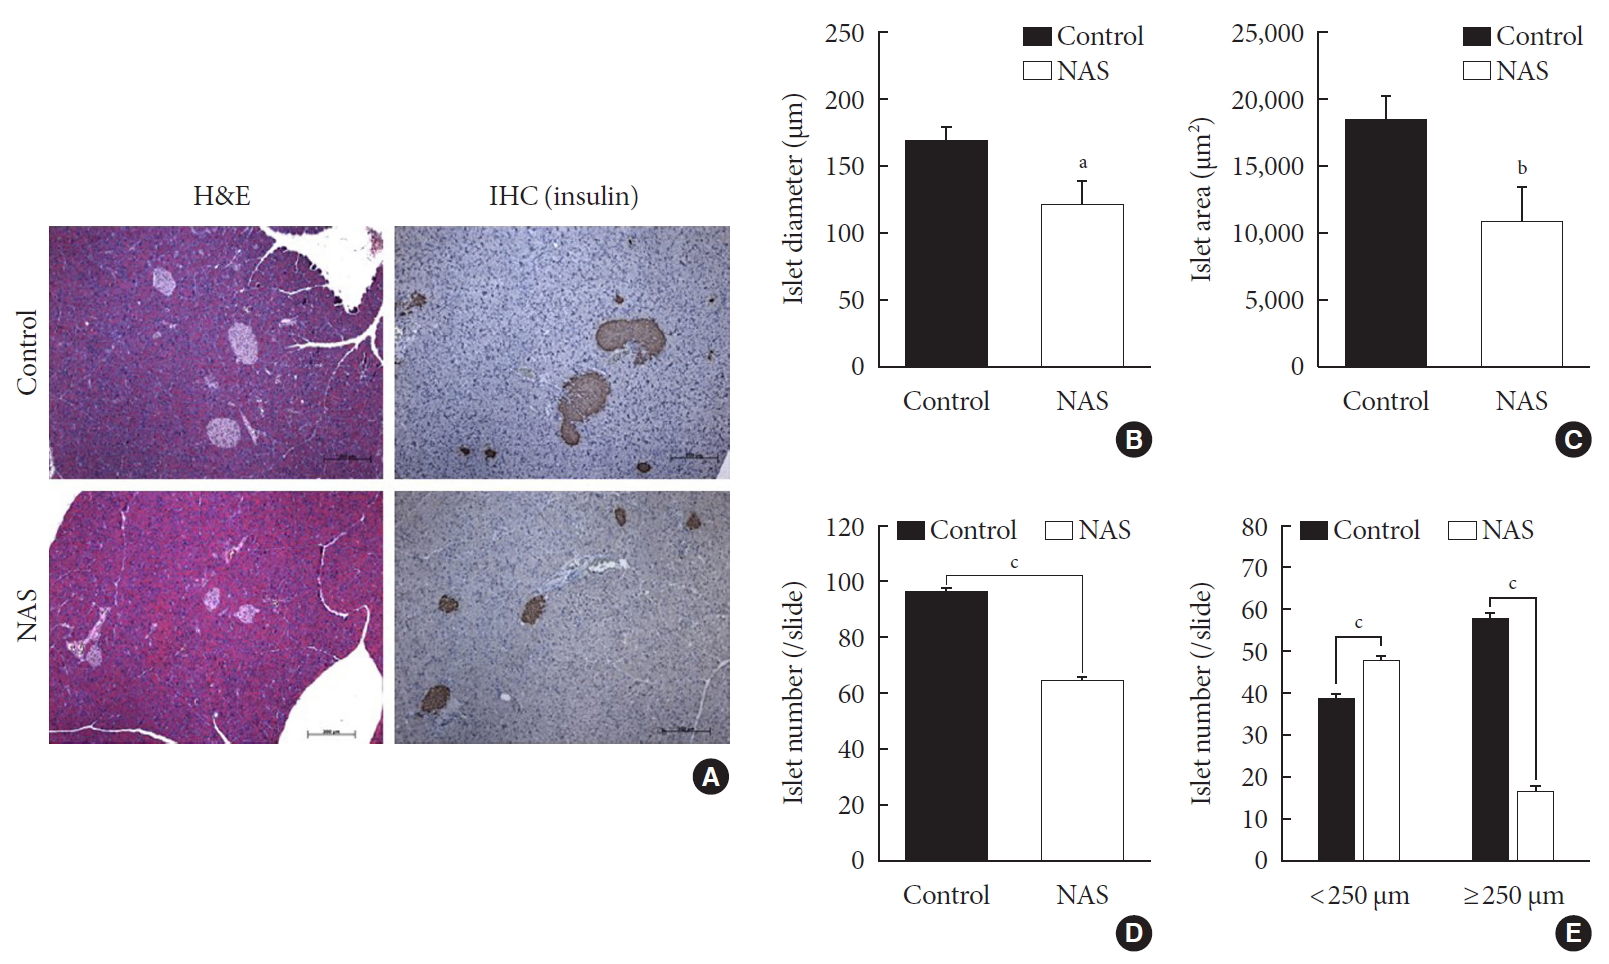
- A histomorphometric analysis of the pancreas was carried out including total islet diameter, area and number/area of the two groups using H&E and IHC staining (Fig. 4A). The diameter (µm) and area (µm2) of islets was significantly lower in the NAS mice compared to the control mice (P<0.05, P<0.05, respectively) (Fig. 4B and C). The total number/area of islets was significantly lower in the NAS mice than in the control mice (P<0.001) (Fig. 4D). The number of small-sized islets (<250 µm) was significantly higher in the NAS mice than in the control mice, while the number of large-sized islet (≥250 µm) was significantly lower in the NAS mice than in the control mice (P<0.001, P<0.001 respectively) (Fig. 4E).
- Inhibition of Notch1 decreases β-cell mass and does not affect α/β-cell ratio
- IHC and IF analyses of islets were carried out to measure the β-cell diameter, area, and α/β-cell ratio in the two groups (Fig. 5A and B). The diameter (µm) and area (µm2) of β-cell was significantly lower in the NAS mice than in the control mice (P<0.05, P<0.05, respectively) (Fig. 5C and D). There was no significant difference in α/β-cell ratio when compared by size (Fig. 5E).
- Inhibition of Notch1 decreases insulin secretion in islets
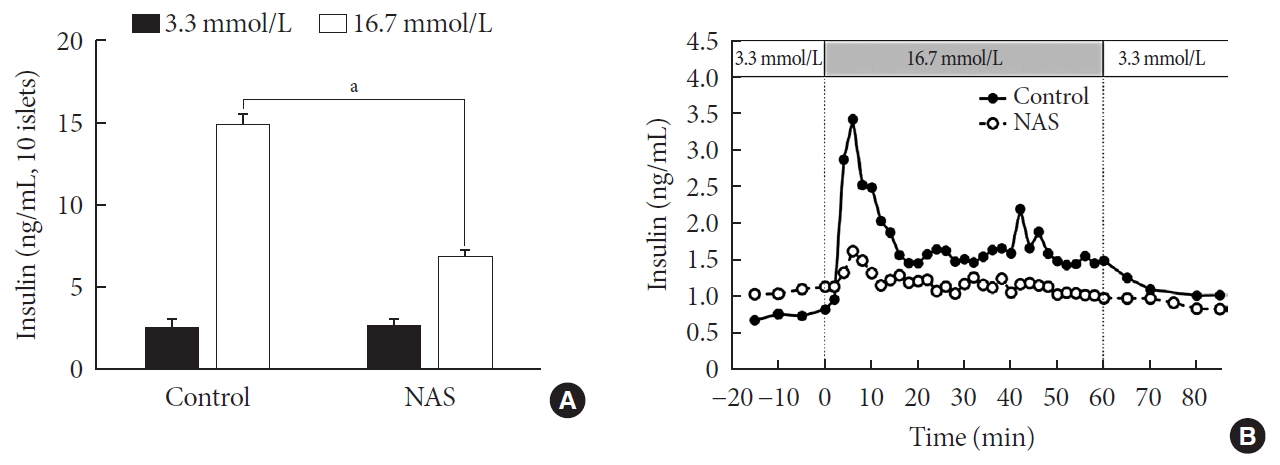
- Pancreatic islets were isolated from the NAS and control mice (n=8 for each group). To examine the insulin secretion capacity of islets, we carried out two methods: glucose-stimulated insulin secretion (GSIS) and perifusion. As shown in Fig. 6A, insulin release at low glucose (3.3 mmol/L) was similar between control and NAS mice. Insulin secretion at high glucose (16.7 mmol/L) was enhanced in control mice. However, glucose-induced insulin secretion was impaired in the NAS mice (P<0.001) (Fig. 6A).
- In perifusion, a golden method for evaluating first-phase insulin secretion of islets in vitro, the islets of the control mice showed increased first-phase insulin secretion, while the NAS mice showed a significant decrease in insulin peaks after increasing glucose (Fig. 6B).
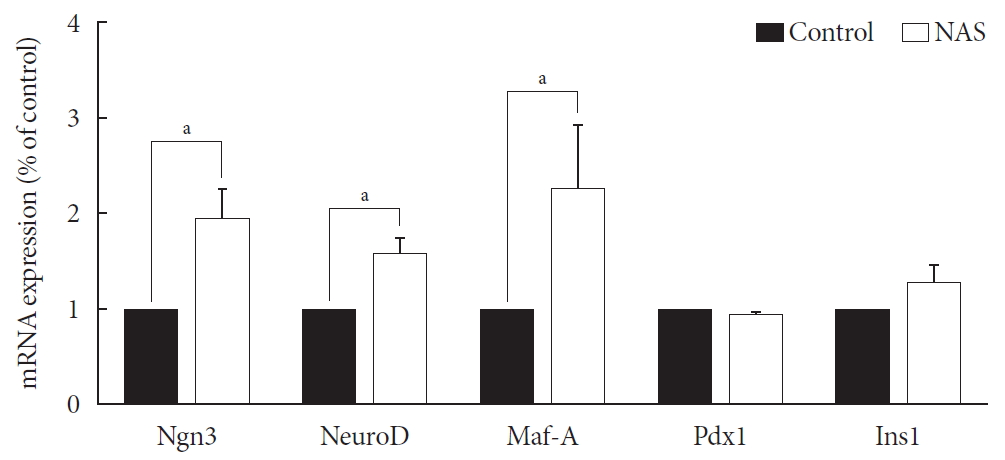
- Neurogenin3, neurogenic differentiation, and MAF bZIP transcription factor A were increased in the NAS mice
- Levels of neurogenin3 (Ngn3), neurogenic differentiation (NeuroD), and MAF bZIP transcription factor A (Maf-A) significantly increased in the NAS mice compared to those in the control mice (P<0.05, P<0.05, P<0.05, respectively). There was no difference in pancreatic and duodenal homeobox 1 (Pdx1) and insulin 1 (Ins1) levels between the two groups (Fig. 7).
RESULTS
- Here, we have demonstrated that the partial inhibition of Notch impaires blood glucose homeostasis, reduces insulin secretion in vivo and in vitro, and reduces islet and β-cell mass in NAS mice. During this study, we discorvered that the Notch signaling pathway may play an important role in insulin secretion and pancreatic islet proliferation in the adult pancreas of mice.
- The development of diabetes is associated with decreased β-cell mass and function. Over the last decade, many studies have been carried out in an attempt to preserve or regenerate β-cell for the treatment of diabetes or to differentiate these from adult pancreatic progenitors, duct cells and nonpancreatic cell types [45232425]. The dedifferentiation of pancreatic β-cells has also been studied [2627].
- The Notch signaling pathywas has been found to maintiain profileration and prevent endocrine differentiation of early progenitor cells. The role of Notch in the development of the pancreas is already known; however, there are few studies regarding Notch in in adult pancreas. Notch may be required for the expansion of adult pancreas ducts where Notch-deficient centroacinar cells do not give rise to endocrine cells [14]. Pajvani et al. [28] demonstrated that combined haploinsufficiency of forkhead box class O1 (FoxO1) and Notch-1 markerdly increased insulin sensitivity in diet-induced insulin resistance, where the inhibition of Notch signaling improved insulin resistance.
- Recently, it has been reported that mice given β-cell specific Notch gain of function (β-NICD) in adult stage had increased β-cell proliferative capacity but a progressive loss of β-cell maturity. In this study, chronic Notch activity in β-cell induced β-cell proliferation without maturation [15]. Although the methods used in the previous study differed from those of our study, the previous results were similar to those of the present study. The findings of both the studies indicated that Notch plays an important role in maintaining β-cell mass by regulating β-cell function and proliferation.
- We used mice with inhibition of Notch function and evaluated the effect of Notch1 inhibition on pancreatic islet proliferation and glucose homeostasis in the adult pancreas. An antisense construct was used in our experiments to reduce Notch signaling. After use of NAS antisense construct, decrease in Notch1 was demonstrated by western blotting. NAS mice experience about 50% decrease in Notch1 expression which resulted in decreased insulin secretion and impaired glucose homeostasis in IPGTT. In terms of changes in morphology, islet and β-cell masses were reduced in NAS mice compared to the control mice. Classified by size, the number of large islets decreased while the number of small islets increased. A decrease in insulin secretion was observed in vitro studies including GSIS and perifusion using isolated islets from NAS mice. In the real-time PCR analysis of transcription factors, Ngn3, NeuroD, and Maf-A increased in the NAS mice compared to levels in the control mice.
- In various previous studies, several transcriptional factors, including Ngn3, Maf-A, Pdx1, and paired box 4 (Pax-4) have been founded to be involved in the final stage of endocrine pancreas development [429]. Ngn3 is the most important transcription factor responsible for driving pancreatic precursors towards an endocrine fate. The differentiation activity of Ngn3 is influenced by Notch signaling. In the developing pancreas, Notch signling regulates Ngn3 expession and inhibition of Notch signaling results in a down-regulation of hes family bHLH trascription factor 1 (HES1) expression and up-regulation of Ngn3 [8]. In the present study, a similar reuslt was obtained; when Notch signaling was inhibited, the levels of Ngn3 increased.
- Maf-A is a β-cell specific transcription factor that interacts with Pdx1 and NeuroD1 to activate the β-cell gene including insulin [3031]. Pdx1 also plays an important role in the regulation of β-cell fate commitment. Enforced Pdx1 expression in endocrine progenitors induces β-cell formation and decreases the number of α-cells [32]. Our study showed higher levels of Ngn3, NeuroD, and Maf-A in NAS mice compared to their levels in control mice; however, the levels of Pdx1 and Ins1 were similar between the two groups. The underlying mechanism has not yet been completely elucidated, and therefore, additional studies are required to determine the mechanism. In the present study, there was no difference in the α/β ratio, which may be related to the similar levels of Pdx1 between the two groups.
- The Notch signaling pathway has been found to maintain proliferation and prevent the precocious differentiation of pancreatic progenitos cells [3334]. But in NAS mice, it is thought that the activity of Notch1 is suppressed from the benining, and thus differentiation occurs without proliferation. In other words, the partial inhibition of Notch1 may suppress the proliferation of islets and induce the differentiation of not fully proliferated small islets. As a result, the reduced amount of islets and β-cells is thought to have exacerbated blood glucose homeostasis and decreased insulin secretion.
- Our study provides the evidence of Notch affecting the maintenance of islet mass and glucose homeostasis in adult stage of mice.
- Unfortunately, we were unable to observe islets morphology in the prenatal and early postnatal stages of NAS mice in this study. As such we could not confirm when these changes took place. The effect of Notch inhibition on pancreatic differentiation and proliferation may be more readily observed if the effect of Notch inhibition is constantly monitored from the embryonic period to the postnatal period. This will needs to be clarified in future studies using a partial pancreatectomized model of NAS mice.
- In conclusion, Notch signaling pathway has an important role in islet and β-cell mass and insulin secretion in mice model. Notch signaling pathway may play an important role in β-cell mass determination and diabetes. Furthermore, clinically, the temporary stimulation of Notch or Notch ligand may induce pancreatic islet proliferation and improve blood glucose homeostasis.
DISCUSSION
-
CONFLICTS OF INTEREST
No potential conflict of interest relevant to this article was reported.
-
AUTHOR CONTRIBUTIONS
Conception or design: K.W.K., B.J.K.
Performing the experiments: Y.S.E., A.R.G., K.M.K., J.Y.Y., H.P.
Acquisition, analysis, or interpretation of data: Y.S.E., A.R.G., K.W.K., B.J.K.
Drafting the work or revising: Y.S.E., A.R.G., B.J.K.
Final approval of the manuscript: Y.S.E, B.J.K.
-
FUNDING
This study was supported by a grant from the Korea Health21 R&D project, Ministry for Health, Welfare, and Family Affairs, Republic of Korea (No. HI14C2539) and grants from the Gachon University Gil Medical Center, Republic of Korea (No. RD 2013-03 and No. RD 2013-50).
NOTES
-
Acknowledgements
- None
ACKNOWLEDGMENTS
SUPPLEMENTARY MATERIALS
Supplementary Table 1
- 1. American Diabetes Association. 2. Classification and diagnosis of diabetes: standards of medical care in diabetes-2018. Diabetes Care 2018;41:S13-S27.ArticlePubMedPDF
- 2. Cernea S, Dobreanu M. Diabetes and beta cell function: from mechanisms to evaluation and clinical implications. Biochem Med (Zagreb) 2013;23:266-280.ArticlePubMedPMC
- 3. Chen C, Cohrs CM, Stertmann J, Bozsak R, Speier S. Human beta cell mass and function in diabetes: recent advances in knowledge and technologies to understand disease pathogenesis. Mol Metab 2017;6:943-957.ArticlePubMedPMC
- 4. Karadimos MJ, Kapoor A, El Khattabi I, Sharma A. β-Cell preservation and regeneration for diabetes treatment: where are we now? Diabetes Manag (Lond) 2012;2:213-222.ArticlePubMedPMC
- 5. Naujok O, Burns C, Jones PM, Lenzen S. Insulin-producing surrogate β-cells from embryonic stem cells: are we there yet? Mol Ther 2011;19:1759-1768.ArticlePubMedPMC
- 6. Apelqvist A, Li H, Sommer L, Beatus P, Anderson DJ, Honjo T, et al. Notch signalling controls pancreatic cell differentiation. Nature 1999;400:877-881.ArticlePubMedPDF
- 7. Murtaugh LC, Stanger BZ, Kwan KM, Melton DA. Notch signaling controls multiple steps of pancreatic differentiation. Proc Natl Acad Sci U S A 2003;100:14920-14925.ArticlePubMedPMC
- 8. Kim W, Shin YK, Kim BJ, Egan JM. Notch signaling in pancreatic endocrine cell and diabetes. Biochem Biophys Res Commun 2010;392:247-251.ArticlePubMed
- 9. Gridley T. Notch signaling and inherited disease syndromes. Hum Mol Genet 2003;12 Spec No 1:R9-R13.ArticlePubMedPDF
- 10. Krebs LT, Xue Y, Norton CR, Shutter JR, Maguire M, Sundberg JP, et al. Notch signaling is essential for vascular morphogenesis in mice. Genes Dev 2000;14:1343-1352.ArticlePubMedPMC
- 11. Xue Y, Gao X, Lindsell CE, Norton CR, Chang B, Hicks C, et al. Embryonic lethality and vascular defects in mice lacking the Notch ligand Jagged1. Hum Mol Genet 1999;8:723-730.ArticlePubMedPDF
- 12. Cheng P, Zlobin A, Volgina V, Gottipati S, Osborne B, Simel EJ, et al. Notch-1 regulates NF-kappaB activity in hemopoietic progenitor cells. J Immunol 2001;167:4458-4467.PubMed
- 13. Shelly LL, Fuchs C, Miele L. Notch-1 inhibits apoptosis in murine erythroleukemia cells and is necessary for differentiation induced by hybrid polar compounds. J Cell Biochem 1999;73:164-175.ArticlePubMed
- 14. Kopinke D, Brailsford M, Pan FC, Magnuson MA, Wright CV, Murtaugh LC. Ongoing Notch signaling maintains phenotypic fidelity in the adult exocrine pancreas. Dev Biol 2012;362:57-64.ArticlePubMed
- 15. Bartolome A, Zhu C, Sussel L, Pajvani UB. Notch signaling dynamically regulates adult β cell proliferation and maturity. J Clin Invest 2019;129:268-280.ArticlePubMed
- 16. Suzuki K, Bonner-Weir S, Hollister J, Weir GC. A method for estimating number and mass of islets transplanted within a membrane device. Cell Transplant 1996;5:613-625.ArticlePubMedPDF
- 17. Wang RN, Kloppel G, Bouwens L. Duct- to islet-cell differentiation and islet growth in the pancreas of duct-ligated adult rats. Diabetologia 1995;38:1405-1411.ArticlePubMedPDF
- 18. Rosenberg L, Brown RA, Duguid WP. A new approach to the induction of duct epithelial hyperplasia and nesidioblastosis by cellophane wrapping of the hamster pancreas. J Surg Res 1983;35:63-72.ArticlePubMed
- 19. Rosenberg L, Duguid WP, Healy M, Clas D, Vinik AI. Reversal of diabetes by the induction of islet cell neogenesis. Transplant Proc 1992;24:1027-1028.PubMed
- 20. Finegood DT, Scaglia L, Bonner-Weir S. Dynamics of beta-cell mass in the growing rat pancreas. Estimation with a simple mathematical model. Diabetes 1995;44:249-256.ArticlePubMed
- 21. Fujimoto WY, Metz SA. Phasic glucose-stimulated insulin secretion by neonatal rat pancreatic islet cells. Enhancement by sodium salicylate. Diabetes 1984;33:872-878.ArticlePubMed
- 22. Bergstrom RW, Fujimoto WY, Teller DC, de Haen C. Oscillatory insulin secretion in perifused isolated rat islets. Am J Physiol 1989;257:E479-E485.ArticlePubMed
- 23. Aguayo-Mazzucato C, Bonner-Weir S. Stem cell therapy for type 1 diabetes mellitus. Nat Rev Endocrinol 2010;6:139-148.ArticlePubMedPDF
- 24. Juhl K, Bonner-Weir S, Sharma A. Regenerating pancreatic beta-cells: plasticity of adult pancreatic cells and the feasibility of in-vivo neogenesis. Curr Opin Organ Transplant 2010;15:79-85.PubMedPMC
- 25. Hanley NA, Hanley KP, Miettinen PJ, Otonkoski T. Weighing up beta-cell mass in mice and humans: self-renewal, progenitors or stem cells? Mol Cell Endocrinol 2008;288:79-85.PubMed
- 26. Talchai C, Xuan S, Lin HV, Sussel L, Accili D. Pancreatic β cell dedifferentiation as a mechanism of diabetic β cell failure. Cell 2012;150:1223-1234.ArticlePubMedPMC
- 27. Accili D, Talchai SC, Kim-Muller JY, Cinti F, Ishida E, Ordelheide AM, et al. When β-cells fail: lessons from dedifferentiation. Diabetes Obes Metab 2016;18 Suppl 1:117-122.ArticlePubMedPDF
- 28. Pajvani UB, Shawber CJ, Samuel VT, Birkenfeld AL, Shulman GI, Kitajewski J, et al. Inhibition of Notch signaling ameliorates insulin resistance in a FoxO1-dependent manner. Nat Med 2011;17:961-967.ArticlePubMedPMCPDF
- 29. Edlund H. Pancreatic organogenesis: developmental mechanisms and implications for therapy. Nat Rev Genet 2002;3:524-532.ArticlePubMedPDF
- 30. Wang H, Brun T, Kataoka K, Sharma AJ, Wollheim CB. MAFA controls genes implicated in insulin biosynthesis and secretion. Diabetologia 2007;50:348-358.ArticlePubMedPDF
- 31. Aramata S, Han SI, Kataoka K. Roles and regulation of transcription factor MafA in islet beta-cells. Endocr J 2007;54:659-666.ArticlePubMed
- 32. Yang YP, Thorel F, Boyer DF, Herrera PL, Wright CV. Context-specific α- to-β-cell reprogramming by forced Pdx1 expression. Genes Dev 2011;25:1680-1685.ArticlePubMedPMC
- 33. Ahnfelt-Ronne J, Hald J, Bodker A, Yassin H, Serup P, Hecksher-Sorensen J. Preservation of proliferating pancreatic progenitor cells by delta-Notch signaling in the embryonic chicken pancreas. BMC Dev Biol 2007;7:63.ArticlePubMedPMCPDF
- 34. Hart A, Papadopoulou S, Edlund H. Fgf10 maintains notch activation, stimulates proliferation, and blocks differentiation of pancreatic epithelial cells. Dev Dyn 2003;228:185-193.ArticlePubMed
REFERENCES
Notch1 antisense construct (NAS-C) is expresssed in 4-week-old NAS mice. Mouse tail genotyping of NAS-C was performed using polymerase chain reaction (PCR) in 4-week-old male NAS and control mice.
Protein expression levels of Notch1 are reduced in 8-week-old male Notch1 antisense transgenic (NAS) mice compared to control mice. (A) Protein expression levels of Notch1, 2, 3, and 4 in the liver by Western blotting and (B) The relative ratio of protein expression level of Notch1, 2, 3, and 4 in two groups. Equal protein loading was confirmed by β-actin (control, n=1; NAS, n=2).
Notch1 inhibition worsens glucose profile and decreases insulin secretion without changing insulin resistance in 8-week-old male Notch1 antisense transgenic (NAS) mice. (A) Body weight and casual glucose level. (B) Glucose profile in intraperitoneal insulin tolerance test (IPGTT) (glucose 2 g/kg). (C) Area under the curve (AUC) of glucose during IPGTT. (D) Serum insulin level at 0, 15, and 30 minutes in IPGTT. (E) Glucose profile in IPITT. (F) AUC of glucose during IPITT. All data are represented as the mean±standard deviation. aP<0.01, bP<0.001 compared to the control mice (control, n=16; NAS, n=16).
Notch1 inhibition decreases islet mass and increases the numbers of small islets compared to large islets. (A) H&E staining and immunohistochemistry (IHC) of pancreatic section. (B) Islet diameter of 8-week-old male Notch1 antisense transgenic (NAS) and control mice. (C) Islet area of 8-week-old male NAS and control mice. (D) Islet number/4 mm2 of 8-week-old male NAS and control mice. (E) Islet number/4 mm2 according to the diameter (<250 µm vs. ≥250 µm). All data are represented as the mean±standard deviation. aP<0.05, bP<0.01, and cP<0.001 compared to the control mice (control, n=6; NAS, n=6).
Notch1 inhibition decreases β-cell mass and does not affect the α/β-cell ratio. (A) Immunohistochemistry (IHC) of islet. (B) Representative images of islets stained with immunofluorescence in 8-week-old male Notch1 antisense transgenic (NAS) and control mice pancreas section. (C) α/β-cell diameter in 8-week-old male NAS and control mice. (D) α/β-cell area of 8-week-old male NAS and control mice. (E) α/β-cell ratio in three groups divided by size (<0.003, 0.003 to 0.03, and >0.03 mm2). All data are represented as the mean±standard deviation. aP<0.05 compared to the control mice (control, n=6; NAS, n=6).

Notch1 inhibition decreases insulin secretion in islet of 8-week-old male Notch1 antisense transgenic (NAS) compared to control mice. (A) Insulin secretion induced by glucose stimulation from 3.3 to 16.7 mmol/L. (B) Insulin release from perifused pancreas of control and NAS mice. All data are represented as the mean±standard deviation. aP<0.001 compared to the control mice (control, n=4; NAS, n=4).
Neurogenin3 (Ngn3), neurogenic differentiation (NeuroD), and MAF bZIP transcription factor A (Maf-A) are increased in 8-week-old male Notch1 antisense transgenic (NAS) mice compared to control mice. Real-time polymerase chain reaction was performed on the transcription factors including Ngn3, NeuroD, Maf-A, pancreatic and duodenal homeobox 1 (Pdx1), and insulin 1 (Ins1). Total mRNA was isolated from mice islet. All data represented as mean±standard deviation. aP<0.05 compared with control mice (control, n=3; NAS, n=4).

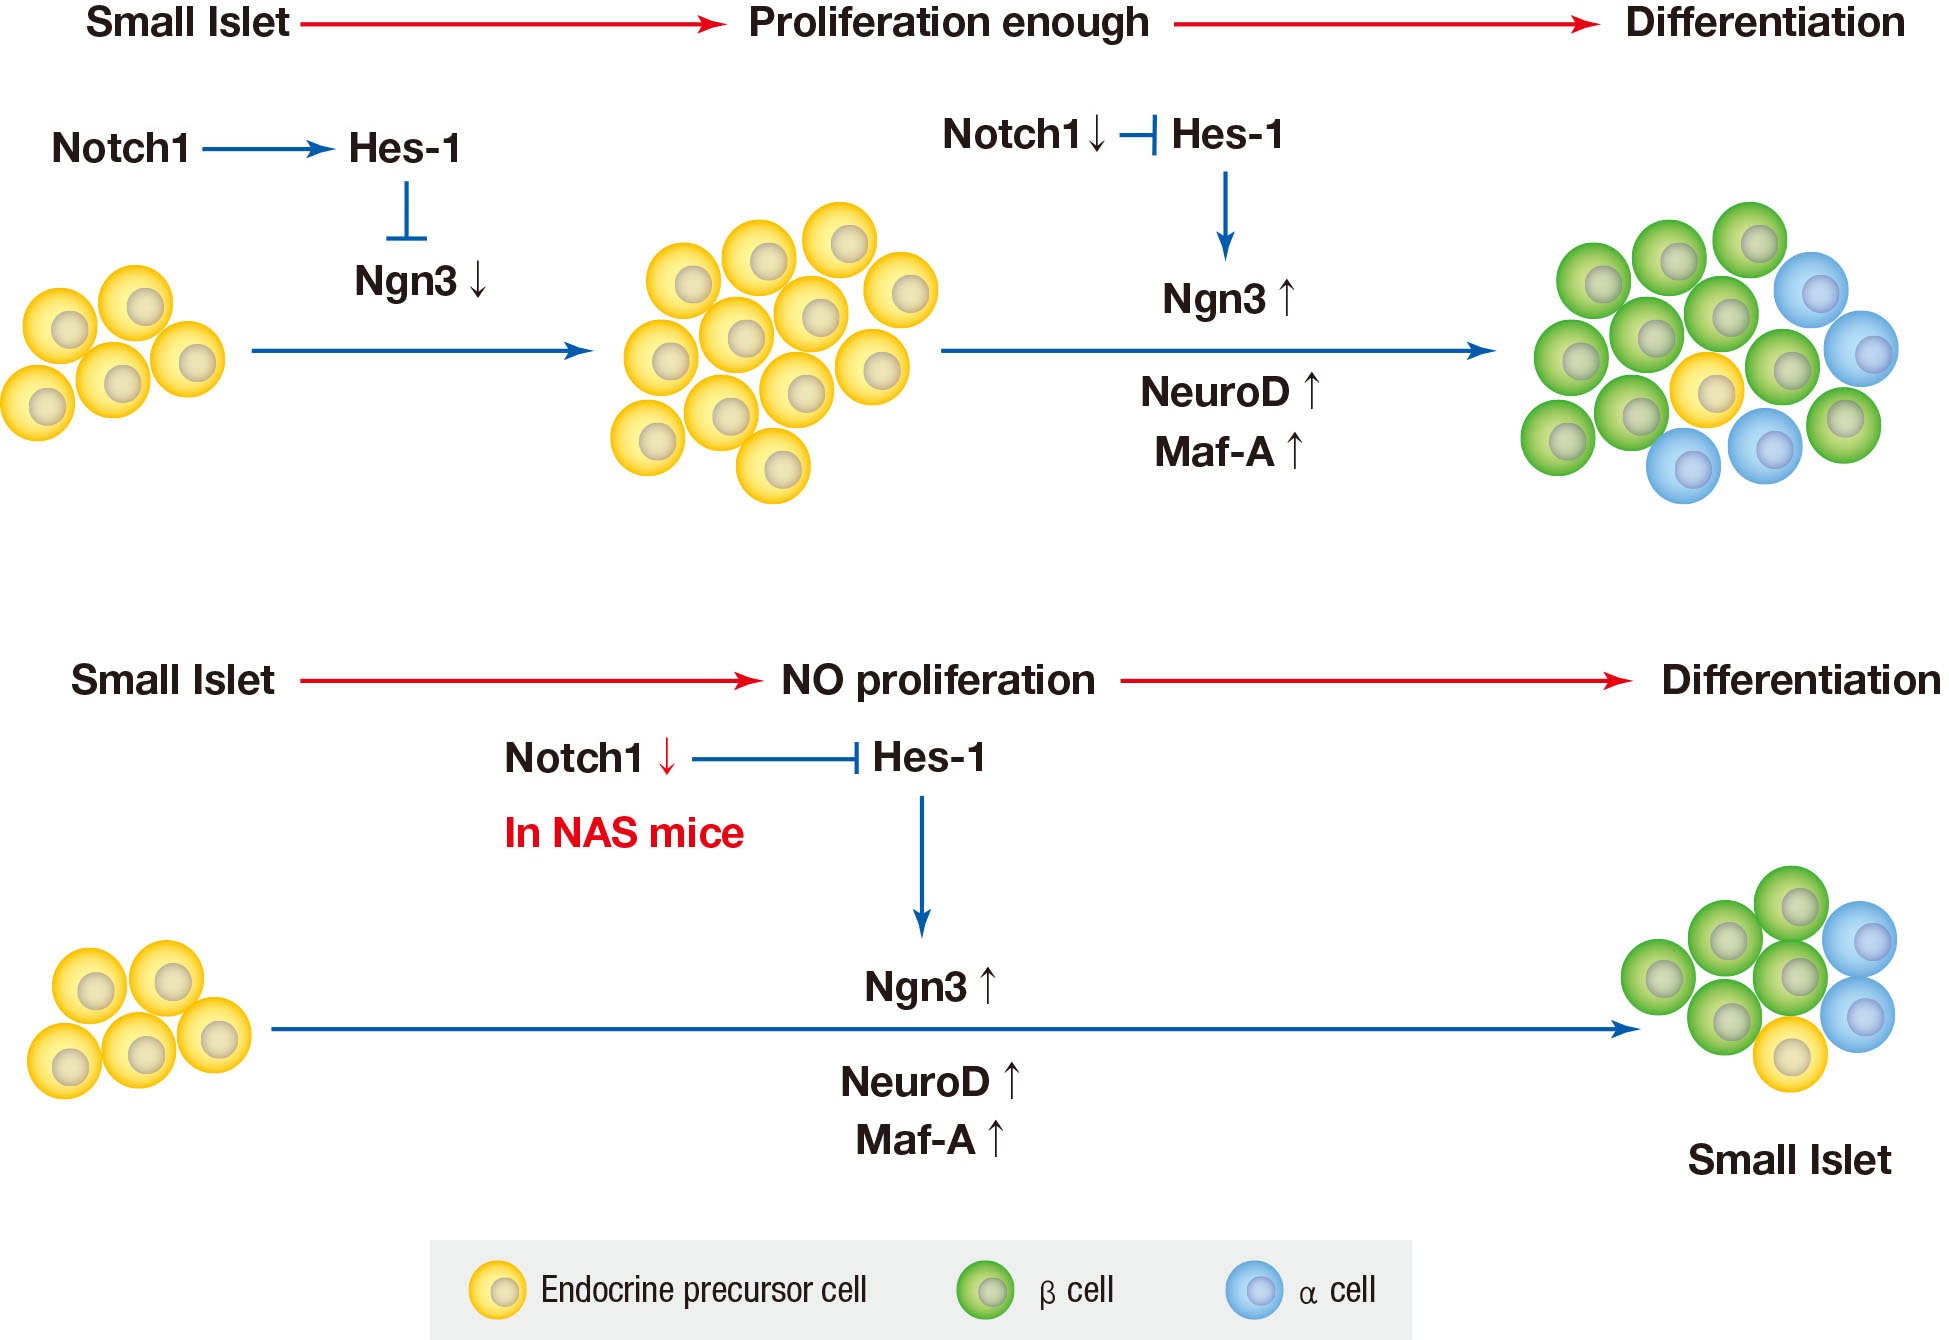
Figure & Data
References
Citations
- N6-methylation of RNA-bound adenosine regulator HNRNPC promotes vascular endothelial dysfunction in type 2 diabetes mellitus by activating the PSEN1-mediated Notch pathway
Ying Cai, Tao Chen, Mingzhu Wang, Lihua Deng, Cui Li, Siqian Fu, Kangling Xie
Diabetes Research and Clinical Practice.2023; 197: 110261. CrossRef - Single‐cell RNA sequencing: Inhibited Notch2 signalling underlying the increased lens fibre cells differentiation in high myopia
Yunqian Yao, Ling Wei, Zhenhua Chen, Hao Li, Jiao Qi, Qingfeng Wu, Xingtao Zhou, Yi Lu, Xiangjia Zhu
Cell Proliferation.2023;[Epub] CrossRef - Micro ribonucleic acid‐363 regulates the phosphatidylinositol 3‐kinase/threonine protein kinase axis by targeting NOTCH1 and forkhead box C2, leading to hepatic glucose and lipids metabolism disorder in type 2 diabetes mellitus
Yu‐Huan Peng, Ping Wang, Xiao‐Qun He, Ming‐Zhao Hong, Feng Liu
Journal of Diabetes Investigation.2022; 13(2): 236. CrossRef - Soluble T-cadherin promotes pancreatic β-cell proliferation by upregulating Notch signaling
Tomonori Okita, Shunbun Kita, Shiro Fukuda, Keita Fukuoka, Emi Kawada-Horitani, Masahito Iioka, Yuto Nakamura, Yuya Fujishima, Hitoshi Nishizawa, Dan Kawamori, Taka-aki Matsuoka, Maeda Norikazu, Iichiro Shimomura
iScience.2022; 25(11): 105404. CrossRef - Comparison of islet isolation result and clinical applicability according to GMP‐grade collagenase enzyme blend in adult porcine islet isolation and culture
Kyungmin Kwak, Jae‐kyung Park, Joohyun Shim, Nayoung Ko, Hyoung‐Joo Kim, Yongjin Lee, Jun‐Hyeong Kim, Michael Alexander, Jonathan R. T. Lakey, Hyunil Kim, Kimyung Choi
Xenotransplantation.2021;[Epub] CrossRef - Genome-Wide Meta-analysis Identifies Genetic Variants Associated With Glycemic Response to Sulfonylureas
Adem Y. Dawed, Sook Wah Yee, Kaixin Zhou, Nienke van Leeuwen, Yanfei Zhang, Moneeza K. Siddiqui, Amy Etheridge, Federico Innocenti, Fei Xu, Josephine H. Li, Joline W. Beulens, Amber A. van der Heijden, Roderick C. Slieker, Yu-Chuan Chang, Josep M. Mercade
Diabetes Care.2021; 44(12): 2673. CrossRef
 PubReader
 ePub Link
 Cite
Cite