A Prospective 1-Year Follow-Up of Glycemic Status and C-Peptide Levels of COVID-19 Survivors with Dysglycemia in Acute COVID-19 Infection
Article information

Abstract
Background
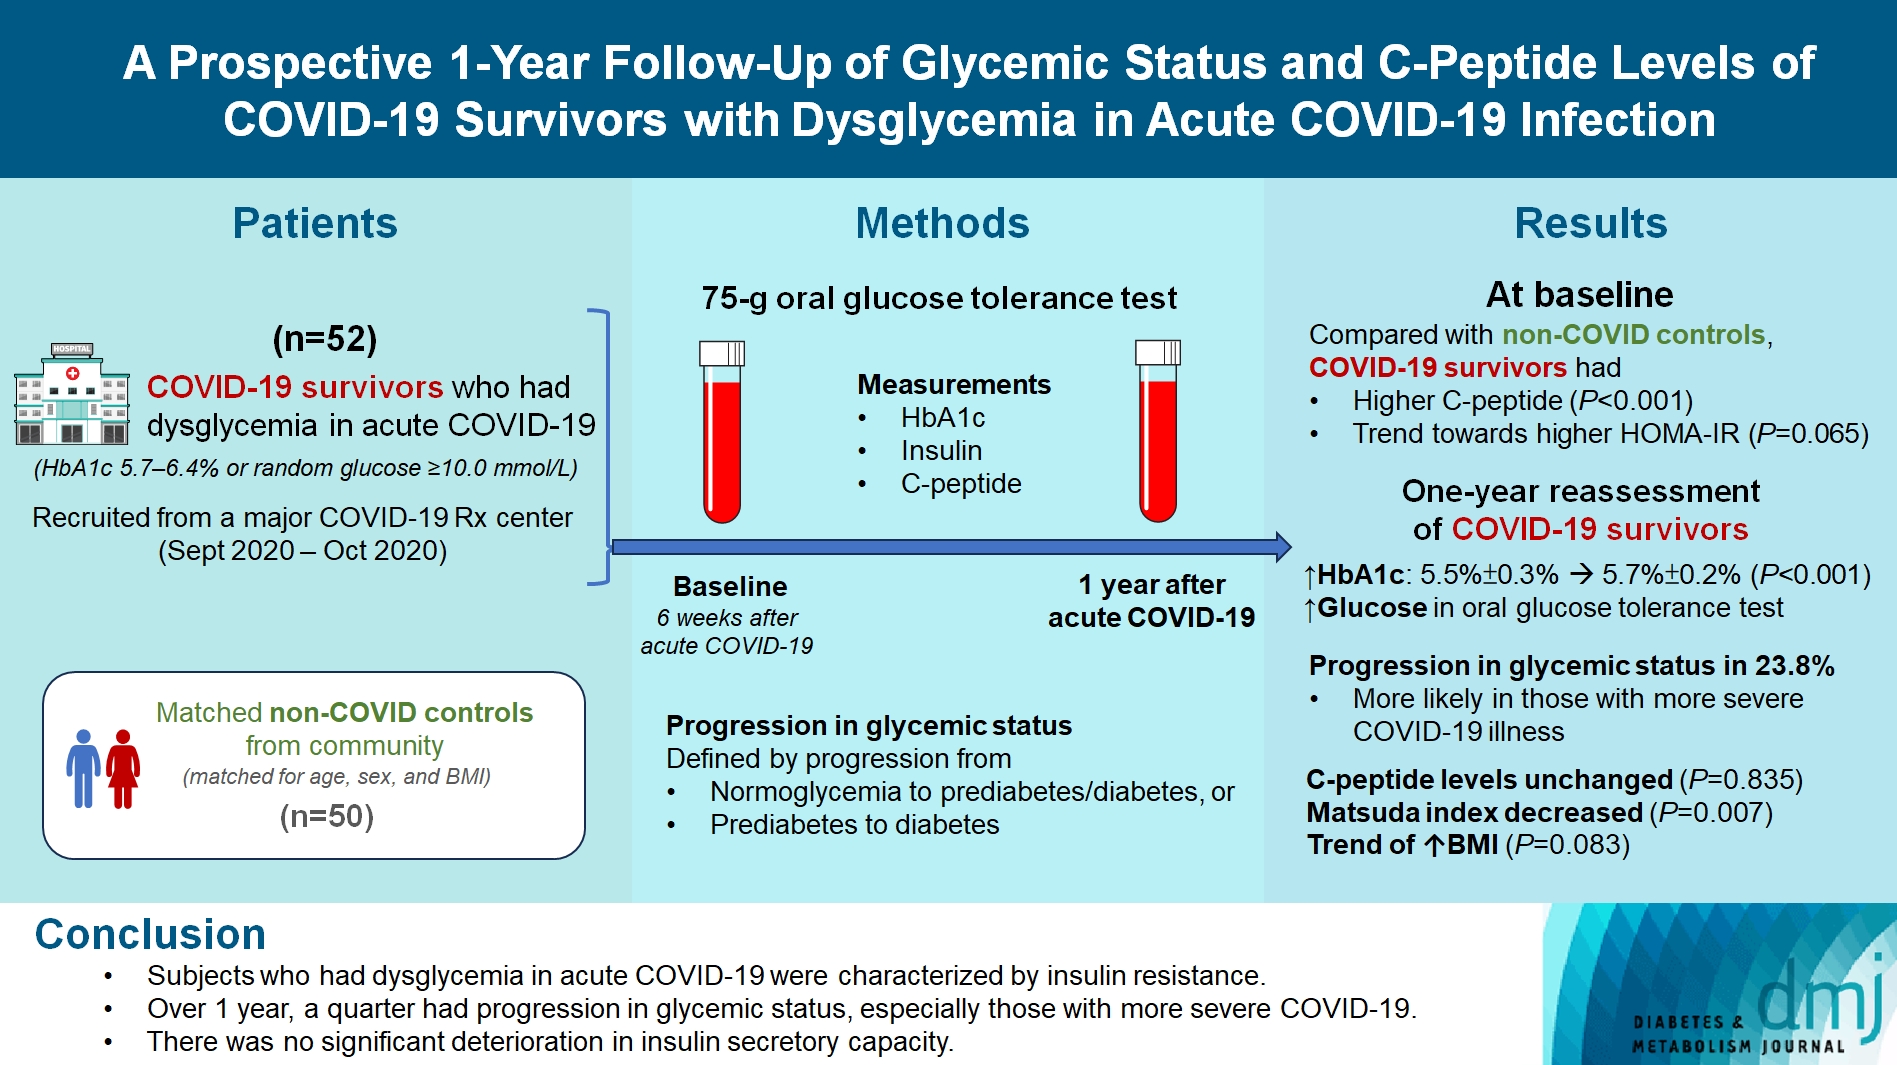
We evaluated changes in glycemic status, over 1 year, of coronavirus disease 2019 (COVID-19) survivors with dysglycemia in acute COVID-19.
Methods
COVID-19 survivors who had dysglycemia (defined by glycosylated hemoglobin [HbA1c] 5.7% to 6.4% or random glucose ≥10.0 mmol/L) in acute COVID-19 were recruited from a major COVID-19 treatment center from September to October 2020. Matched non-COVID controls were recruited from community. The 75-g oral glucose tolerance test (OGTT) were performed at baseline (6 weeks after acute COVID-19) and 1 year after acute COVID-19, with HbA1c, insulin and C-peptide measurements. Progression in glycemic status was defined by progression from normoglycemia to prediabetes/diabetes, or prediabetes to diabetes.
Results
Fifty-two COVID-19 survivors were recruited. Compared with non-COVID controls, they had higher C-peptide (P< 0.001) and trend towards higher homeostasis model assessment of insulin resistance (P=0.065). Forty-three COVID-19 survivors attended 1-year reassessment. HbA1c increased from 5.5%±0.3% to 5.7%±0.2% (P<0.001), with increases in glucose on OGTT at fasting (P=0.089), 30-minute (P=0.126), 1-hour (P=0.014), and 2-hour (P=0.165). At baseline, 19 subjects had normoglycemia, 23 had prediabetes, and one had diabetes. Over 1 year, 10 subjects (23.8%; of 42 non-diabetes subjects at baseline) had progression in glycemic status. C-peptide levels remained unchanged (P=0.835). Matsuda index decreased (P=0.007) and there was a trend of body mass index increase from 24.4±2.7 kg/m2 to 25.6±5.2 (P=0.083). Subjects with progression in glycemic status had more severe COVID-19 illness than non-progressors (P=0.030). Reassessment was not performed in the control group.
Conclusion
Subjects who had dysglycemia in acute COVID-19 were characterized by insulin resistance. Over 1 year, a quarter had progression in glycemic status, especially those with more severe COVID-19. Importantly, there was no significant deterioration in insulin secretory capacity.
Highlights
• This study assessed glycemic changes in COVID-19 survivors with dysglycemia.
• Insulin resistance was observed in individuals with dysglycemia during acute COVID-19.
• Over a year, a quarter showed progression in glycemic status.
• There was no significant decline in insulin secretory capacity.
INTRODUCTION
The coronavirus disease 2019 (COVID-19) pandemic, caused by severe acute respiratory syndrome coronavirus 2 (SARS-CoV-2), has infected more than 760 million individuals as of May 2023 and caused close to 7 million deaths worldwide [1]. With the ever-increasing number of COVID-19 survivors, evaluation of the long-term sequelae of COVID-19 infection helps to inform surveillance strategies among COVID-19 survivors [2]. The expression of angiotensin-converting enzyme 2 (ACE2), the entry receptor for SARS-CoV-2, has been found not only in the respiratory system, but also in extra-pulmonary systems including the pancreas [3], raising concerns about new-onset diabetes after SARS-CoV-2 infection from the potential direct effect on pancreatic β-cells [4-6].
Several nationwide cohorts have provided data supporting possible increased risks of incident diabetes following acute SARS-CoV-2 infection [7]. A cohort using the database from the United States Department of Veteran Affairs showed a 40% excess risk of incident diabetes over a median follow-up of 1 year, mostly type 2 diabetes mellitus (T2DM) [8]. Similarly, a study using German nationwide database showed 30% excess risk of incident T2DM after SARS-CoV-2 infection with a median follow-up duration of 4 months, compared to other acute respiratory illness [9]. Recently, a Korean nationwide database also demonstrated a 30% excess risk of T2DM following COVID-19 infection over a median follow-up of 11 months [10]. Furthermore, there are suggestions of increased events of diabetic ketoacidosis during the COVID-19 pandemic, raising concerns of pancreatic β-cell destruction related to SARS-CoV-2 [11].
To date, data were limited regarding the insulin secretory capacity of COVID-19 survivors. Clarke et al. [12] performed a post hoc analysis of 55 COVID-19 survivors evaluated at least 3 months after acute COVID-19, showing that all of them had detectable C-peptide levels, suggesting that insulinopenia was not apparent in post-acute COVID-19. Nonetheless, baseline C-peptide levels were not available in that study, limiting further interpretation of the effect of COVID-19 infection on the subsequent changes in the insulin secretory capacity.
There are certain limitations in the existing literature. Individuals included in the retrospective observational populationbased studies were not systematically evaluated for the glycemic status. Furthermore, information regarding the changes in the insulin secretory capacity among COVID-19 survivors was not available in the study by Clarke et al. [12]. Hence, it is important to evaluate systematically the evolution of glycemic status and insulin secretory capacity among COVID-19 survivors. In this study, we aimed to evaluate the 1-year changes in glycemic status and insulin secretory capacity of COVID-19 survivors who had dysglycemia at baseline.
METHODS
The study followed the principles in the Declaration of Helsinki and was approved by the Institutional Review Board of the University of Hong Kong/Hospital Authority Hong Kong West Cluster (IRB Ref.: UW 20-666). All participants gave written informed consent prior to participation into the study.
Participants
COVID-19 survivors who had dysglycemia (defined by glycosylated hemoglobin [HbA1c] 5.7% to 6.4% or random glucose ≥10.0 mmol/L) during hospitalization for acute COVID-19 were recruited from Queen Mary Hospital (a major COVID-19 treatment center) between 1 September, 2020 and 31 October, 2020. Patients with prior history of diabetes were excluded. During the recruitment period, public health ordinance in Hong Kong required all patients who tested positive for COVID-19 to be admitted to the hospital, including those detected on contact tracing and the Universal Community Testing Programme, regardless of symptoms [13].
COVID-19 severity was classified according to the ‘Chinese clinical guidance for COVID-19 pneumonia diagnosis and treatment (7th edition)’ published by the Chinese National Health Commission [14]. Mild disease was defined by mild clinical symptoms without manifestations of pneumonia on imaging. Moderate disease was defined by fever and respiratory symptoms, and manifestations of pneumonia on imaging. Severe disease was defined by any of the following: respiratory rate ≥30/min, oxygen saturation ≤93% at rest, and >50% progression in 48 hours on imaging. Critical disease was defined by respiratory failure requiring mechanical ventilation, shock, and intensive care unit admission. C-reactive protein (CRP) levels during hospitalization for COVID-19 were retrieved with CRP >0.76 mg/dL considered elevated [15].
As a pilot study, we aimed to recruit 50 COVID-19 survivors. For comparison, non-COVID controls matched for age, sex, body mass index (BMI) and HbA1c were recruited from the community.
Biochemical assessments
The recruited COVID-19 survivors attended a clinical assessment session after an overnight fast for at least 8 hours. The 75-g oral glucose tolerance test (OGTT) were performed at baseline (6 weeks after discharge from hospitalization for acute COVID-19) and 1 year after acute COVID-19, along with measurements of HbA1c, insulin and fasting C-peptide levels. HbA1c was measured in whole blood using cation-exchange high-performance liquid chromatography. The assay was certified by National Glycohemoglobin Standardization Programme and standardized to Diabetes Control and Complications Trial reference assay [15]. Insulin levels were measured using Human Insulin Quantikine enzyme-linked immunosorbent assay (ELISA) kit (R&D Systems Inc., Minneapolis, MN, USA) with intraassay coefficient of variability (CV) of 3.7%–4.0% and inter-assay CV of 6.9%–7.5%. C-peptide levels were measured using human C-peptide quantikine ELISA kit (R&D Systems Inc.) with intra-assay CV of 1.6%–4.5% and inter-assay CV of 7.6%–9.8%. The homeostasis model assessment of insulin resistance (HOMA-IR) was calculated as fasting plasma insulin (mIU/L)×fasting glucose (FG, in mmol/L) divided by 22.5. Homeostasis model assessment of β-cell function (HOMA-β) was calculated as (20×fasting plasma insulin [mIU/L]) divided by (FG [mmol/L]–3.5) [16]. Insulin sensitivity represented by the Matsuda index was calculated by the formula:
which highly correlated with the insulin sensitivity obtained with euglycemic clamp [17]. High-sensitivity C-reactive protein (hsCRP) was measured using high-sensitive human C-reactive protein ELISA kit (ImmunoDiagnostics Limited, Hong Kong) with intra-assay CV of 4.3% and inter-assay CV of 5.9%.
Definitions of glycemic status
Based on the evaluations at baseline (6 weeks after discharge from hospitalization for acute COVID-19), the COVID-19 survivors were categorised into the following glycemic status. Their glycemic status was re-evaluated at 1 year using the same criteria. Diabetes was defined by FG ≥7.0 mmol/L, HbA1c ≥6.5%, or 2-hour plasma glucose (2hPG) >11.0 mmol/L. Prediabetes was defined by FG 5.6 to 6.9 mmol/L, 2hPG 7.8 to 11.0 mmol/L, or HbA1c 5.7% to 6.4%. Subjects not meeting criteria for prediabetes/diabetes were classified as normoglycemia. Progression in glycemic status was defined by progression from (1) normoglycemia to prediabetes/diabetes, or (2) prediabetes to diabetes.
Study outcomes
The primary outcome was the comparison of C-peptide levels between COVID-19 survivors and non-COVID controls. Secondary outcomes were (1) the changes in glycemic status and insulin secretory capacity over 1 year among the COVID-19 survivors; and (2) factors associated with progression in glycemic status among COVID-19 survivors.
Statistical analyses
All statistical analyses were performed with IBM SPSS version 26 (IBM Co., Armonk, NY, USA). Two-sided P<0.05 were considered statistically significant. Values not normally distributed were logarithmically transformed before analyses. Data were presented as mean±standard deviation, median with interquartile range (IQR) or number with percentage as appropriate. Between-group comparisons were performed with independent-sample t-test for continuous variables and chi-square test for categorical variables as appropriate. Pairwise comparisons of clinical and laboratory parameters of COVID-19 survivors at baseline and 1-year reassessment were performed using paired t-test.
Data availability
Datasets generated during and/or analyzed during the current study are not publicly available but are available from the corresponding author on reasonable request.
RESULTS
Characteristics of COVID-19 survivors: with reference to non-COVID controls
In total, 52 COVID-19 survivors and 50 non-COVID controls were recruited. There were no significant differences in age, sex, and BMI between the two groups. Compared with non-COVID controls, the COVID-19 survivors had higher C-peptide levels (P<0.001) and trend towards higher indices of insulin resistance (HOMA-IR; P=0.065) (Table 1). hsCRP levels did not differ between the two groups at baseline (i.e., 6 weeks after discharge from hospitalization for acute COVID-19 infection for the COVID-19 group)–COVID-19 survivors (0.85 mg/L [IQR, 0.42 to 1.44]) versus non-COVID controls (0.61 mg/L [IQR, 0.22 to 1.63]) (P=0.452). Nonetheless, when we reviewed the CRP levels of the COVID-19 survivors during hospitalization for acute COVID-19 infection, 42 of them (80.8%) had elevated CRP levels with a median CRP level of 3.01 mg/dL (IQR, 1.07 to 6.10).

Comparison of clinical characteristics of COVID-19 survivors at baseline assessment and non-COVID controls
Changes in clinical parameters among COVID-19 survivors over 1 year
Among the 52 COVID-19 survivors, 43 (82.7%) attended the 1-year reassessment. The 43 subjects who attended reassessment were comparable with the nine subjects who did not turn up for the reassessment in terms of age (P=0.604), sex (P>0.999), BMI (P=0.466), FG (P=0.122), C-peptide level (P=0.632), HOMA-IR (P=0.461), and HOMA-β (P=0.771), except higher HbA1c among those who did not turn up for reassessment (5.8%±0.3% vs. 5.5%±0.3%, P=0.009).
At 1-year reassessment, HbA1c increased from baseline of 5.5%±0.3% to 5.7%±0.2% (P<0.001). Concomitantly, glucose levels were higher at reassessment OGTT at all time points compared with OGTT at baseline, although only the increase in 1 hour glucose reached statistical significance (P=0.014) (Table 2).
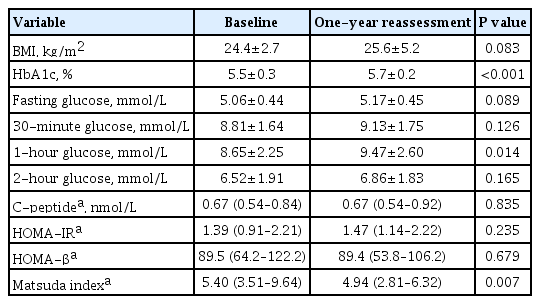
Changes in clinical and laboratory parameters from baseline to 1-year reassessment (n=43)
When evaluated according to categories of glycemic status (defined by HbA1c and OGTT criteria), at baseline, 19 subjects (44.2%) had normoglycemia, 23 subjects (53.5%) had prediabetes, and one (2.3%) had diabetes. Upon 1 year, 10 subjects (of the 42 subjects without diabetes at baseline) had progression in glycemic status, giving a progression rate of 23.8%. Among the 10 subjects with progression in glycemic status, nine progressed from normoglycemia to prediabetes, and one progressed from prediabetes to diabetes.
Importantly, there was no significant change in the C-peptide levels (P=0.835). Matsuda index (indicative of insulin sensitivity) showed a significant decrease over 1 year (P=0.007). Concomitantly, there was a trend of increase in BMI from 24.4±2.7 to 25.6±5.2 kg/m2 (P=0.083) (Table 2). The levels of hsCRP did not show significant change over the year (from 0.88 mg/L [IQR, 0.39 to 1.45] to 0.82 mg/L [IQR, 0.50 to 1.36], P=0.928). Reassessment of glycemic status, BMI, C-peptide levels and indices of insulin resistance was not performed in the control group for comparison.
Factors associated with progression in glycemic status among COVID-19 survivors
Subjects who had progression in glycemic status had more severe COVID-19 illness than non-progressors (P=0.030), but otherwise comparable regarding age, sex, BMI, and other laboratory parameters (Table 3). hsCRP did not differ between progressors and non-progressors (progressors 0.71 mg/L [IQR, 0.30 to 2.20] vs. non-progressors 0.88 mg/L [IQR, 0.46 to 1.55], P=0.546). However, when considering the CRP levels during hospitalization for acute COVID-19 infection, the progressors had higher CRP levels than the non-progressors (progressors 5.26 mg/dL [IQR, 1.26 to 8.05] vs. non-progressors 2.45 mg/dL [IQR, 1.04 to 5.41], P=0.408), although not reaching statistical significance likely due to the small sample size. To elucidate the reasons for higher rate of progression in glycemic status among survivors of severe COVID-19, we compared the five survivors of severe COVID-19 with the 37 survivors of non-severe COVID-19. Survivors of severe COVID-19 had numerically higher CRP levels during hospitalization for acute COVID-19 infection (4.47 mg/dL [IQR, 2.56 to 7.81] vs. 2.46 mg/dL [IQR, 0.88 to 5.76], P=0.375). Although subsequent hsCRP levels measured at 6 weeks after discharge from hospital did not differ between survivors of severe and non-severe COVID-19, survivors of severe COVID-19 were characterized by higher degree of insulin resistance, i.e., higher HOMA-IR (1.62 [IQR, 1.52 to 2.96] vs. 1.20 [IQR, 0.90 to 2.14], P=0.152) and lower Matsuda index (3.33 [IQR, 2.96 to 4.05] vs. 6.75 [IQR, 4.09 to 10.0], P=0.043).

Comparison of baseline characteristics between COVID-19 survivors who did and did not have progression in glycaemic status over 1 year (n=42)
DISCUSSION
In this prospective 1-year follow-up study of COVID-19 survivors, subjects who had dysglycemia in acute COVID-19 were characterized by a state of insulin resistance. A quarter of the COVID-19 survivors had progression in their glycemic status upon 1-year follow-up. Furthermore, we identified more severe COVID-19 illness as the risk factor of progression in glycemic status. Importantly, there was no significant deterioration in the insulin secretory capacity over 1 year.
There was initial concern for SARS-CoV-2 infection to cause new-onset diabetes, because ACE2 expression was found in the pancreas, providing a potential mechanistic link [3]. Indeed, there have been case reports of diabetic ketoacidosis at the time of diagnosis of COVID-19 infection [18]. Nonetheless, the HbA1c levels for these cases were often high, suggestive of undiagnosed diabetes picked up during COVID-19 infection. With the help of a non-COVID control group matched for age, sex, and BMI, we demonstrated that the C-peptide levels of COVID-19 survivors soon after recovery from acute COVID-19 were indeed higher than non-COVID group. The observation was reassuring that there was no significant decrease in the insulin secretion among people who suffered from COVID-19 infection. Moreover, the higher C-peptide levels likely represented an insulin resistant state. This was consistent with the trend towards higher levels of HOMA-IR among COVID-19 survivors. Although there was no difference in the hsCRP levels at baseline (i.e., 6 weeks after discharge from hospitalization for acute COVID-19), most COVID-19 survivors had elevated CRP levels during hospitalization for acute COVID-19 infection. This supports the notion that the elevated insulin resistance among COVID-19 survivors is initially partly contributed by the inflammation cascades associated with COVID-19 infection [19], while the inflammation associated with acute COVID-19 infection has subsequently resolved in the convalescent phase.
Epidemiological evidence from population-based electronic health databases suggested an increase in the incidence of diabetes (mainly T2DM) after COVID-19 infection [7], including cohorts from the United States [8], Germany [9], and Korea [10]. The longest average duration of follow-up for these population-based cohort studies was approximately 1 year. In these studies, it remained possible that COVID-19 survivors might have increased health care utilization, explaining the higher likelihood of diagnosis of diabetes among COVID-19 survivors than those without COVID-19 infection. Furthermore, the mechanisms underlying the increased risk of new-onset diabetes could not be examined in these studies. To address the concern of changes in insulin secretory capacity following COVID-19 infection, Clarke et al. [12] previously showed no significant evidence of insulinopenia after COVID-19 infection among 55 survivors, but baseline C-peptide levels were lacking. Our study contributed valuable data to the literature from several perspectives. First, with the help of OGTT, our study characterized the glycemic status of COVID-19 survivors in detail. We observed a small increase in HbA1c over 1 year from a mean of 5.5% to 5.7%, and this was accompanied by increase in glucose levels at various time points measured in the OGTT, reaching statistical significance especially for the 1-hour glucose levels. This is in keeping with previous observation of an increased risk of diabetes following COVID-19 infection. Second, with the serial measurements of C-peptide levels at baseline and at 1 year after COVID-19 infection, we revealed no significant reduction in C-peptide levels even over 1 year’s time, consistent with the time of follow-up in the aforementioned population-based studies. Furthermore, we demonstrated that insulin resistance indicated by Matsuda index, deteriorated over 1 year among COVID-19 survivors. The fact that HOMA-IR did not show a statistically significant difference over 1 year could be because Matsuda index has an additional value for the detection of insulin resistance beyond the ability of HOMA-IR [20]. Taken together, it is less likely that SARS-CoV-2 directly damages the endocrine pancreas and cause significant impairment in the insulin secretory capacity. On the other hand, there was an increase in insulin resistance among COVID-19 survivors. The increase in insulin resistance can be contributed directly by the inflammation of COVID-19, or indirectly through the changes in the lifestyle after COVID-19 infection [21]. The trend of BMI increase from an average of 24.4 to 25.6 kg/m2 over 1 year among the COVID-19 survivors may suggest the contribution of lifestyle changes to the increase in insulin resistance, and in turn, the deterioration of glycemic status [22]. As the hsCRP levels did not differ between COVID-19 survivors and non-COVID control group at baseline, and the hsCRP levels did not change among COVID-19 survivors over 1 year, it could be inferred that inflammation may not play a major role in the subsequent increase in insulin resistance in the convalescent phase.
Our study identified severity of COVID-19 infection to be the only factor associated with progression in glycemic status among COVID-19 survivors, consistent with the reported risk factors in a recent meta-analysis [7]. More severe COVID-19 infection is more likely to be associated with more significant inflammation [23], which in turn may be associated with increase in insulin resistance and progression in glycemic status [24]. Our results further suggested that the patients with more severe COVID-19 had a higher degree of inflammation associated with COVID-19, reflected by the higher CRP levels in the acute COVID-19 infection. This in turn enhanced the insulin resistance, and therefore, predisposed survivors of more severe COVID-19 to a higher chance of subsequent progression in glycemic status. While the inflammation associated with acute COVID-19 infection has subsequently resolved in the convalescent phase, the progression in glycemic status in the convalescent phase is likely driven by lifestyle changes, rather than persistent inflammation. Our results may suggest the need to monitor the glycemic profile especially among the survivors of more severe COVID-19 infection.
We reported a systematic assessment of glycemic status with OGTT, together with the indices of insulin secretion and resistance, over 1 year of follow-up, providing valuable insights into the pathophysiology of increased risk of diabetes following COVID-19 infection. Nonetheless, there are certain limitations in this study. First, as this was a pilot study with a relatively small sample size, our results warrant further larger studies for validation. Second, none of the COVID-19 survivors received vaccination during the time of the study, and all COVID-19 survivors were infected by the ancestral strain of SARS-CoV-2. These may limit the generalizability of our results to the current situation of the pandemic. Third, although a non-COVID control group was available at baseline for characterization of the COVID-19 survivors, reassessment glycemic status was not available in the non-COVID control group for the comparison of the rate of progression in glycemic status. Fourth, detailed information related to lifestyle changes during the COVID-19 pandemic was not available. Nonetheless, the BMI changes observed in our study could capture the outcomes related to lifestyle changes. Last but not least, our results were generated from exclusively Chinese individuals and may not apply to individuals from other ethnicities.
In conclusion, subjects who had dysglycemia in acute COVID-19 were characterized by a state of insulin resistance. Over 1-year follow-up, a quarter of them had progression in glycemic status, especially among those with more severe COVID-19 illness. Nonetheless, there was no significant deterioration in the insulin secretory capacity.
Notes
CONFLICTS OF INTEREST
No potential conflict of interest relevant to this article was reported.
AUTHOR CONTRIBUTIONS
Conception or design: D.T.W.L., C.H.L., Y.C.W., K.C.B.T.
Acquisition, analysis, or interpretation of data: D.T.W.L., Y.W., C.H.Y.F.
Drafting the work or revising: D.T.W.L., K.H.T., K.C.B.T.
Final approval of the manuscript: D.T.W.L., C.H.L., Y.W., C.H.Y.F., K.H.T., Y.C.W., K.C.B.T.
FUNDING
The study received funding support from the Diabetes Hongkong Diabetes Care Research Fund (RF202201). David Tak Wai Lui is a recipient of Li Ka Shing Medical Fellowship for Internal Medicine (2023). The funders had no role in study design, data collection and analysis, decision to publish, or preparation of the manuscript.
Acknowledgements
None