Switching from Conventional Fibrates to Pemafibrate Has Beneficial Effects on the Renal Function of Diabetic Subjects with Chronic Kidney Disease
Article information
 , Hiroshi Nomoto,1, Kenichi Kito1, Yuki Yamauchi1, Kazuno Omori1, Yui Shibayama1, Shingo Yanagiya1, Aika Miya1, Hiraku Kameda1, Kyu Yong Cho1, So Nagai2, Ichiro Sakuma3, Akinobu Nakamura1, Tatsuya Atsumi1, on Behalf of the PARM-T2D Study Group
Abstract
Background
Fibrates have renal toxicity limiting their use in subjects with chronic kidney disease (CKD). However, pemafibrate has fewer toxic effects on renal function. In the present analysis, we evaluated the effects of pemafibrate on the renal function of diabetic subjects with or without CKD in a real-world clinical setting.
Methods
We performed a sub-analysis of data collected during a multi-center, prospective, observational study of the effects of pemafibrate on lipid metabolism in subjects with type 2 diabetes mellitus complicated by hypertriglyceridemia (the PARM-T2D study). The participants were allocated to add pemafibrate to their existing regimen (ADD-ON), switch from their existing fibrate to pemafibrate (SWITCH), or continue conventional therapy (CTRL). The changes in estimated glomerular filtration rate (eGFR) over 52 weeks were compared among these groups as well as among subgroups created according to CKD status.
Results
Data for 520 participants (ADD-ON, n=166; SWITCH, n=96; CTRL, n=258) were analyzed. Of them, 56.7% had CKD. The eGFR increased only in the SWITCH group, and this trend was also present in the CKD subgroup (P<0.001). On the other hand, eGFR was not affected by switching in participants with severe renal dysfunction (G3b or G4) and/or macroalbuminuria. Multivariate analysis showed that being older and a switch from fenofibrate were associated with elevation in eGFR (both P<0.05).
Conclusion
A switch to pemafibrate may be associated with an elevation in eGFR, but to a lesser extent in patients with poor renal function.
INTRODUCTION
Long-term hyperglycemia associated with diabetes can lead to the development of micro- and macrovascular complications. Of these, people with diabetes and chronic kidney disease (CKD), defined by urinary albumin excretion and/or impaired renal function, is emerging as an important global public health problem. CKD develops in 30% to 40% of subjects with type 2 diabetes mellitus (T2DM) [1,2], and accounts for a large proportion of cases of end-stage renal failure [3]. The impaired kidney function affects the ability of subjects to metabolize drugs. Therefore, pharmacological therapies in the absence of renal toxicity are needed.
Dyslipidemia is a common comorbidity in people with T2DM, and the use of fibrates, which ameliorate hypertriglyceridemia and increase the circulating concentration of high-density lipoprotein cholesterol (HDL-C), has been shown to reduce the progression of renal insufficiency [4]. However, the use of conventional fibrates can lead to a worsening of renal function, limiting their use in subjects with CKD. Relevant to this, pemafibrate, a selective peroxisome proliferator-activated receptor (PPAR) α modulator that is principally metabolized by the liver, has recently become clinically available. In a previous phase III trial, renal side effects were less frequent in the pemafibrate group than in the fenofibrate group [5]. On the other hand, the increase in the number of patients with renal adverse events in the Pemafibrate to Reduce Cardiovascular Outcomes by Reducing Triglycerides in Patients with Diabetes (PROMINENT) trial was reported [6]. Thus, it is unclear whether pemafibrate is clinically useful in subjects with impaired renal function and whether the addition of pemafibrate or switching to pemafibrate from a conventional fibrate is beneficial for renal outcomes. Therefore, in the present study, we focused to evaluate the effects of pemafibrate on renal function in diabetic subjects with or without CKD in a real-world clinical setting.
METHODS
Study design and participants
We performed a post hoc secondary analysis of data derived from a multi-center prospective observational study that compared the efficacy and safety of pemafibrate with those of conventional therapies in subjects with T2DM (the PARM-T2D study) [7]. The original study was conducted at nine specialized centers for the treatment of diabetes located in Hokkaido, Japan (the PARM-T2D study group) [7]. Briefly, 685 adults with T2DM and hypertriglyceridemia, including individuals on or not on a conventional fibrate, were enrolled. After providing their written informed consent, the participants were treated with pemafibrate 0.2 to 0.4 mg/day or continue conventional therapy (CTRL) for hyperlipidemia. Fasting blood and urine samples were collected and physical assessments were performed at baseline, and then repeated after 12, 24, and 52 weeks of the study.
For the present sub-analysis, participants without relevant renal functional nor urinalysis data were excluded. The remaining participants were allocated to three groups: fibrate-naïve individuals who administered pemafibrate (ADD-ON), those who were switched from a conventional fibrate to pemafibrate (SWITCH), and those who CTRL. In addition, subgroups were created according to the presence or absence of CKD based on the definition of Kidney Disease: Improving Global Outcomes (KDIGO), accompanied by micro- or macroalbuminuria (urinary albumin-to-creatinine ratio [UACR] ≥30 mg/gCr or proteinuria) and/or an estimated glomerular filtration rate (eGFR) ≤60 mL/min/1.73 m2 at baseline [8]. The eGFR was estimated based on serum creatinine levels, age and gender.
The PARM-T2D study was registered with the University Hospital Medical Information Network (UMIN) Center Clinical Trials Registry (UMIN000037385). The protocol was approved by the Institutional Review Board of Hokkaido University Hospital Clinical Research and Medical Innovation Center (approval number 018-0440) and the study was performed in accordance with the principles of the Declaration of Helsinki and its amendments. All the patients provided their informed consent before participation.
Statistical analysis
Normally distributed continuous data are expressed as mean± standard deviation, non-normally distributed continuous data are expressed as median (interquartile range), and categorical data are expressed as number (%). Comparisons of two groups were made using the unpaired t-test or the Mann-Whitney U-test for continuous variables, and the chi-square test or Fisher’s exact test for categorical variables. Comparisons among the three groups were made using analysis of variance (ANOVA), the Kruskal-Wallis test, or the chi-square test. Within-group comparisons were made using the paired t-test or the Wilcoxon signed-rank test. Changes in variables from baseline are expressed as mean or median (95% confidence interval), and the groups were compared using the Kruskal-Wallis test, followed by Dunn’s post hoc analysis. Relationships between variables were evaluated using Pearson’s correlation analysis or Spearman’s rank correlation analysis. Multiple linear regression analysis was used to identify factors that were independently associated with the outcomes. Data were analyzed using GraphPad Prism version 8.4.2 (GraphPad Software Inc., San Diego, CA, USA) or JMP Pro version 16.0.0 (SAS Inc., Cary, NC, USA).
RESULTS
A total of 685 participants were enrolled and 650 met the inclusion criteria for the PARM-T2D study. However, 102 were excluded for the reasons described previously [7]. From this original cohort, comprising 548 participants, those in the absence of renal function nor urinalysis data were excluded from the present sub-analysis. As a result, data from 262 participants in the pemafibrate group and 258 in the control group were analyzed. Of the pemafibrate users, 166 were in the ADD-ON group and 96 were in the SWITCH group. The overall prevalence of CKD was 56.7% (Fig. 1). There were no significant differences in the baseline characteristics or metabolic parameters of the three groups, except with respect to albuminuria category A2 (Tables 1 and 2). In addition, the diabetes treatment regimens were similar among the groups, except with respect to the use of thiazolidinediones. Notably, 29.1% of the CTRL group was being treated with a conventional fibrate (Supplementary Table 1).
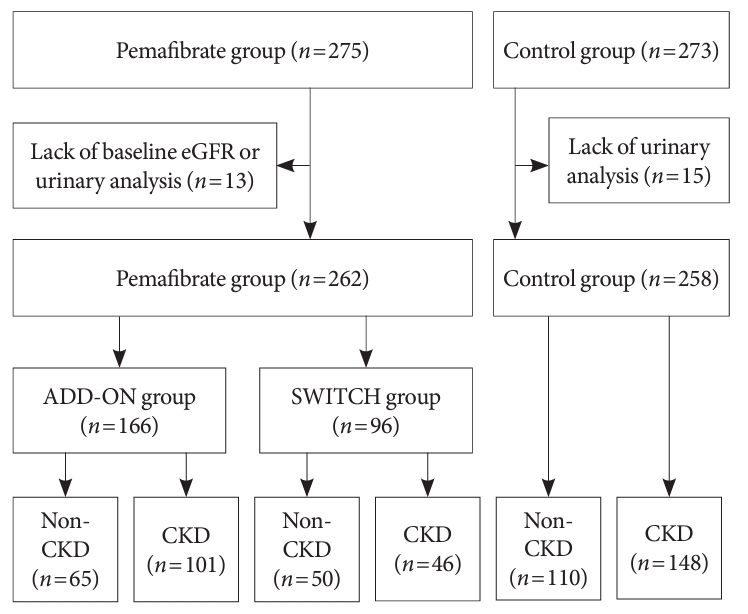
Flow diagram for the study. Participants in the original cohort without renal function nor urinalysis data were excluded. The pemafibrate group comprised fibrate-naïve patients who started to take pemafibrate (the ADD-ON group) and those switched from another fibrate to pemafibrate when they had been on long-term fibrate therapy (the SWITCH group). The participants were then allocated to two subgroups: a chronic kidney disease (CKD) subgroup, for those with chronic kidney disease, and a non-CKD group. eGFR, estimated glomerular filtration rate.

Baseline clinical characteristics of the participants

Clinical parameters at baseline and the changes that occurred from baseline
After 52 weeks of treatment, the eGFR had significantly increased only in the SWITCH group. There was a significant decline in eGFR in the ADD-ON group, but the difference from the CTRL group was not significant (Table 2, Fig. 2A). Similar results were obtained if comparing ADD-ON group with the CTRL group that did not receive fibrate treatment and SWITCH group with the CTRL group that continued to receive conventional fibrate medication (Supplementary Tables 2 and 3). An increase in eGFR after the switch to pemafibrate also occurred in the CKD subgroup (Fig. 2B). A more detailed analysis of the SWITCH group showed that the effects of pemafibrate on kidney function differed according to the baseline CKD status: eGFR elevated in participants with G1 and G2 (eGFR ≥60 mL/min/1.73 m2) or G3a (45≤ eGFR <60 mL/min/1.73 m2), but not in those with G3b or G4 (eGFR <45 mL/min/1.73 m2) (Fig. 3A). Similarly, switching to pemafibrate increased the eGFR of participants with normo- or microalbuminuria (A1 [UACR <30 mg/gCr] or A2 [30≤ UACR <300 mg/gCr]), but not in those with macroalbuminuria and/or proteinuria (A3 [UACR ≥300 mg/gCr]) (Fig. 3B, Supplementary Table 4). On the other hand, there is no significant difference by eGFR category in ADD-ON (Supplementary Fig. 1A). By albuminuria category, there was a significant decrease in eGFR in subjects with A2 and A3 after pemafibrate treatment, and this reduction was significant in A3 compared to A1 (Supplementary Table 4, Supplementary Fig. 1B). The administration of pemafibrate also improved the lipid profiles and liver-related parameters of the participants: the triglyceride (TG) and HDL-C concentrations, and the alanine aminotransferase and γ-glutamyl transpeptidase activities, showed greater improvements in the ADD-ON group. However, switching from a conventional fibrate to pemafibrate increased the uric acid (UA) concentrations of the participants (all P<0.001) (Table 2).
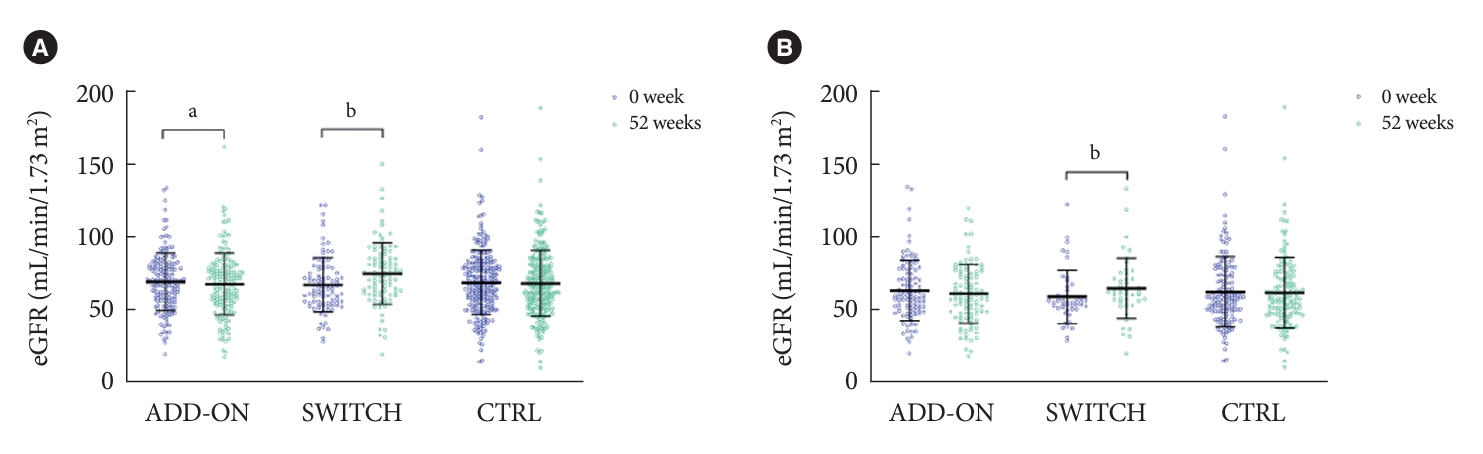
Estimated glomerular filtration rates (eGFRs) before and the end of the study period. Bars are as mean±standard deviation. Purple and green circles represent 0 and 52 weeks, respectively. (A) Entire cohort (ADD-ON, n=166; SWITCH, n=96; control [CTRL], n=258). (B) Chronic kidney disease subgroups (ADD-ON, n=101; SWITCH, n=46; CTRL, n=148). aP<0.05, bP<0.001 between 0 and 52 weeks (Paired t-test).

Changes in estimated glomerular filtration rate (eGFR) during the study period in the SWITCH group. Markers and bars represent the mean change (95% confidence interval). (A) Blue closed circles, orange closed squares, and red closed triangles represent G1 and G2 (n=62), G3a (n=27), and G3b and G4 (n=7), respectively. (B) Blue open circles, orange open squares, and red open triangles represent A1 (n=69), A2 (n=20), and A3 (n=6), respectively. aP<0.05, bP<0.001 vs. 0 week (analysis of variance [ANOVA], followed by Tukey’s post hoc analysis); cP<0.05, dP<0.01 for the difference between the groups (Kruskal-Wallis test, follow by Dunn’s post hoc analysis).
Next, to identify the factors related to the increase in eGFR that occurred following the switch to pemafibrate, we evaluated the relationships between the change in eGFR and the baseline clinical characteristics of the participants. Correlation analysis revealed that being older and a low baseline TG concentrations were associated with the elevation in eGFR (Supplementary Table 5). In addition, participants treated with fenofibrate showed larger increase in eGFR than those with bezafibrate (Supplementary Fig. 2). Multiple linear regression analysis using these components as covariates showed that age and the type of fibrate used were significantly associated with the outcome (Table 3).

Relationships between the change in estimated glomerular filtration rate after the switch to pemafibrate and baseline clinical parameters, according to multiple linear regression analysis
DISCUSSION
In the present sub-analysis of data collected during a previous prospective observational study of the efficacy and safety of use of the pemafibrate in subjects with T2DM, we found that a switch from a conventional fibrate to pemafibrate increased renal function, assessed using eGFR, and this trend was replicated in those participants with CKD. Previous large-scale clinical trials have shown that fibrates reduce the incidence of progression of renal disease in subjects with T2DM in the long-term observation [4,9], and a recent metanalysis showed that fibrate use was associated with a lower incidence of the progression of albuminuria and a higher incidence of improvement. However, fibrates have been shown to be initially associated with an increase in creatinine and a decrease in eGFR, irrespective of the presence or absence of diabetes [10].
Multiple linear regression analysis revealed that use of the fenofibrate, rather than bezafibrate, and being older were independent predictors of an elevation in renal function after switching to pemafibrate. In the Action to Control Cardiovascular Risk in Diabetes (ACCORD) lipid trial, the following were identified as predictors of fibrate-associated renal dysfunction: older age, male sex, and the use of angiotensin-converting enzyme inhibitors and/or thiazolidinediones [11]. The Fenofibrate Intervention and Event Lowering in Diabetes (FIELD) study, assessed the long-term efficacy of fenofibrate administration with regard to cardiovascular outcomes and diabetic complications, revealed that it reduced the incidences of the progression of albuminuria and retinopathy requiring laser treatment; however, renal function, assessed using serum creatinine concentration and eGFR, significantly deteriorated during the treatment, and increased after the cessation of fenofibrate administration [4].
Although the mechanism of the transient renal impairment caused by fibrates has not been fully determined, there are several candidates: an increase in the production of creatinine [12]; altered renal hemodynamics, owing to the amelioration of metabolic abnormalities, including dyslipidemia and hypertension [11]; and lower vasodilatory prostaglandin concentrations, especially in the afferent arteriole, secondary to lower renal cyclooxygenase-2 expression [13,14]. Given that a number of organs and a wide range of genes are involved in the metabolism of creatinine and are regulated by PPARα [15,16], complex interactions have been predicted [11]. Interestingly, thiazolidinedione, which is a PPARγ agonist, can cause an increase in serum creatinine in subjects with diabetes [17]. The concomitant use of a thiazolidinedione and fenofibrate has also been reported to be associated with a higher incidence of an increase in serum creatinine concentration [11]. Although the precise mechanisms of the interaction have not been determined, an additive effect on PPARs might represent a plausible explanation.
As discussed above, the administration of a conventional fibrate can increase the risk of a reduction in eGFR [10]. The increase in the number of patients with renal adverse events in the PROMINENT trial was also consistent with previous observations regarding fenofibrate [6]. However, the high specificity of pemafibrate for PPARα means that the undesirable increase in creatinine that arises from off-target effects can be avoided. In an animal study, pemafibrate ameliorated diabetic nephropathy via reduction of renal lipid content and oxidative stress [18]. Although a direct comparison of the risks associated with the use of fibrates has not been made, participants with CKD and those who showed the progression of micro- or macro albuminuria had more frequently been treated with bezafibrate than fenofibrate (Supplementary Fig. 3), which might have affected the results in the present study. Since fenofibrate has been shown to decrease UA concentrations by increasing UA excretion [19], it is plausible that UA was increased in the SWITCH group and not in the ADD-ON group in the present study.
In general, older subjects tend to be at a higher risk of metabolic disorders and atherosclerotic diseases [20,21], and their renal function is vulnerable to several treatment interventions [22]. Therefore, such a risk of impaired renal function represents a barrier to the use of the most appropriate drug intervention. Although the deleterious effects of fibrates on kidney function have been reported to be transient [4], there is a certain burden to select a fibrate for use in subjects with progressive kidney disease considering that the plasma concentrations of fibrates can be high even in the presence of mild kidney dysfunction [23]. In the present study, we have clarified the benefit of pemafibrate with respect to renal protection in subjects with T2DM, in the presence or absence of CKD. Pemafibrate is principally metabolized in the liver; therefore, it is expected to have less of an effect on renal function [24], and given that conventional fibrates can reduce eGFR, it is reasonable to switch patients to pemafibrate to reduce the risk of a reduction in eGFR. A notable finding of the present study is that this reduction in the risk of a deterioration of renal function is absent in subjects with advanced renal failure and/or proteinuria. Therefore, it would be important to prescribe pemafibrate for subjects with T2DM before their renal damage progresses.
The present sub-analysis had several strengths. We were able to assess the effects of pemafibrate on renal function in subjects with T2DM and a broad range of eGFR values, including in those who were fibrate-naïve and in those who were switched from conventional fibrate therapy. It has clarified the differing effects of pemafibrate on renal function according to the presence or absence of CKD and the baseline treatment regimen. In addition, we excluded only a small number of the participants for whom renal function data were not available, thereby minimizing the loss of power. The limitations of the original trial have been described previously; it featured an open-label observational design, which may be associated with selection bias, only Japanese subjects were recruited, and there were no restrictions with respect to changes in the treatments for comorbidities [7]. In addition to these original limitations, there were few participants with moderate-to-severe renal dysfunction, because the use of pemafibrate in subjects with severe renal function was not recommended until September 2022 in Japan. Therefore, a randomized controlled trial of subjects with T2DM and progressive CKD, aiming to assess its renoprotective effect, should be conducted in the next future.
In conclusion, a switch from a conventional fibrate to pemafibrate can ameliorate impairments in renal function in subjects with T2DM, but this effect is with lower extent in subjects with progressive CKD. Such a treatment strategy should be beneficial for the management of hypertriglyceridemia in subjects with diabetes and early CKD treated with a fibrate.
SUPPLEMENTARY MATERIALS
Supplementary materials related to this article can be found online at https://doi.org/10.4093/dmj.2023.0370.
Treatment regimens for comorbidities
Clinical parameters at baseline and the changes that occurred from baseline (ADD-ON vs. fibrate-untreated control)
Clinical parameters at baseline and the changes that occurred from baseline (SWITCH vs. fibrate-treated control)
Change in eGFR during the study period in each group, categorized according to eGFR and the presence or absence of albuminuria
Relationships between the change in estimated glomerular filtration rate after the switch to pemafibrate and baseline clinical parameters
Changes in estimated glomerular filtration rate (eGFR) during the study period in the ADD-ON group. Markers and bars represent the mean change (95% confidence interval). (A) Blue closed circles, orange closed squares, and red closed triangles represent G1 and G2 (n=112), G3a (n=39), and G3b and G4 (n=15), respectively. (B) Blue open circles, orange open squares, and red open triangles represent A1 (n=94), A2 (n=59), and A3 (n=11), respectively. aP<0.05 vs. 0 week (analysis of variance [ANOVA], followed by Tukey’s post hoc analysis), bP<0.05, cP<0.01 for the difference between the groups (KruskalWallis test, follow by Dunn’s post hoc analysis).
(A) Bezafibrate vs. fenofibrate. (B) Statin (–) vs. statin (+). Change in the estimated glomerular filtration rate (eGFR) during the study period in the SWITCH group, categorized according to the treatment for dyslipidemia being used at baseline. NS, not significant.
(A) Ratio of patients suffering chronic kidney disease (CKD) (bezafibrate vs. fenofibrate). (B) Ratio of patients suffering micro- and macroalbuminuria (bezafibrate vs. fenofibrate). Percentages of the participants with CKD or grade A2/A3 albuminuria being treated with bezafibrate or fenofibrate.
Notes
CONFLICTS OF INTEREST
Hiroshi Nomoto, Ichiro Sakuma, Akinobu Nakamura, and Tatsuya Atsumi have received honoraria for lectures and research funding from the organizations listed below. The other authors declare no conflict of interest.
AUTHOR CONTRIBUTIONS
Conception or design: H.N.
Acquisition, analysis, or interpretation of data: R.I., H.N., K.K., Y.Y., K.O., Y.S., S.Y., A.M., H.K., K.Y.C., S.N., I.S., A.N.
Drafting the work or revising: R.I., H.N., A.M., H.K., K.Y.C., A.N., T.A.
Final approval of the manuscript: all the authors.
FUNDING
Hiroshi Nomoto received research grants from Kowa Pharmaceutical Co. Ltd., and honoraria for lectures from Novo Nordisk Pharma and Sumitomo Pharma Co. Ltd. Ichiro Sakuma received research grants from Kowa Pharmaceutical Co. Ltd. Akinobu Nakamura has received research support from Mitsubishi Tanabe Pharma, Daiichi Sankyo, MSD, Novo Nordisk Pharma, Novartis Pharma, AstraZeneca, Life Scan Japan, and Taisho Pharmaceutical Co. Ltd. Tatsuya Atsumi received research grants from Astellas Pharma Inc., Takeda Pharmaceutical Co. Ltd., Mitsubishi Tanabe Pharma Co., Chugai Pharmaceutical Co. Ltd., Daiichi Sankyo Co. Ltd., Otsuka Pharmaceutical Co. Ltd., Pfizer Inc., Alexion Inc., Ono Pharmaceutical Co. Ltd., and Teijin Pharma Ltd.; and speaking fees from Mitsubishi Tanabe Pharma Co., Chugai Pharmaceutical Co. Ltd., Astellas Pharma Inc., Takeda Pharmaceutical Co. Ltd., Pfizer Inc., AbbVie Inc., Eisai Co. Ltd., Daiichi Sankyo Co. Ltd., Bristol-Myers Squibb Co., UCB Japan Co. Ltd., Eli Lilly Japan K.K., Novartis Pharma K.K., Eli Lilly Japan K.K., Kyowa Kirin Co. Ltd., and Taisho Pharmaceutical Co. Ltd., and fees for consultancies from AstraZeneca plc., Medical & Biological Laboratories Co. Ltd., Pfizer Inc., AbbVie Inc., Ono Pharmaceutical Co. Ltd., Novartis Pharma K.K., and Nippon Boehringer Ingelheim Co. Ltd.
Acknowledgements
Part of this study was presented at the International Diabetes Federation Western Pacific Congress (IDF-WPR) Congress 2023/15th Scientific Meeting of the Asian Association for the Study of Diabetes (AASD). The manuscript and related data have not been published elsewhere, nor are they under consideration by another journal. All the authors have contributed significantly to the study and agree with the content of the manuscript.
The authors would like to express their gratitude to all the patients and staff who participated in the study. The authors would particularly like to thank Dr. Hideaki Miyoshi for his contributions to the conception, design, and supervision of the original study. The manuscript was edited by Mark Cleasby, PhD from Edanz (https://jp.edanz.com/ac).