Effects of Exercise Training and Chlorogenic Acid Supplementation on Hepatic Lipid Metabolism in Prediabetes Mice
Article information

Abstract
Background
Since prediabetes is a risk factor for metabolic syndromes, it is important to promote a healthy lifestyle to prevent prediabetes. This study aimed to determine the effects of green coffee (GC), chlorogenic acid (CGA) intake, and exercise training (EX) on hepatic lipid metabolism in prediabetes male C57BL/6 mice.
Methods
Forty-nine mice were randomly divided into two groups feeding with a normal diet (n=7) or a high-fat diet (HFD, n=42) for 12 weeks. Then, HFD mice were further divided into six groups (n=7/group): control (pre-D), GC, CGA, EX, GC+EX, and CGA+EX. After additional 10 weeks under the same diet, plasma, and liver samples were obtained.
Results
HFD-induced prediabetes conditions with increases in body weight, glucose, insulin, insulin resistance, and lipid profiles were alleviated in all treatment groups. Acsl3, a candidate gene identified through an in silico approach, was lowered in the pre-D group, while treatments partly restored it. HFD induced adverse alterations of de novo lipogenesis- and β oxidation-associated molecules in the liver. However, GC and CGA supplementation and EX reversed or ameliorated these changes. In most cases, GC or CGA supplementation combined with EX has no synergistic effect and the GC group had similar results to the CGA group.
Conclusion
These findings suggest that regular exercise is an effective non-therapeutic approach for prediabetes, and CGA supplementation could be an alternative to partially mimic the beneficial effects of exercise on prediabetes.
INTRODUCTION
The liver plays a crucial role in energy metabolism and thus hepatic dysregulation can contribute to the development of metabolic diseases [1]. Non-alcoholic fatty liver disease (NAFLD) is a pathological syndrome distinguished by excessive lipid droplets in liver cells, which are closely related to insulin resistance (IR), especially hepatic IR [2]. A high-fat diet (HFD) is known to increase lipid accumulation and impair β-oxidation in the liver and HFD-induced lipid accumulation can inhibit insulin degradation in the liver, therefore contributing to hyperinsulinemia [3]. Hyperinsulinemia increases the chance to precede prediabetes which is characterized by impaired glucose tolerance (140≤ glucose level ≤199 mg/dL in response to 70 g oral glucose) or impaired fasting glucose (IFG) (100≤ fasting plasma glucose ≤125 mg/dL) level in human [4]. Since prediabetes is one of the major risk factors, a therapeutic strategy to reduce liver fat accumulation is crucial for preventing the progression of type 2 diabetes mellitus (T2DM) and NAFLD [2].
As a non-therapeutic lifestyle-changing strategy, the beneficial effects of exercise on decreasing diabetes rates have been widely known. Endurance training can significantly reduce symptoms in pre-Diabetic patients [5]. Accumulated data also demonstrate that regular exercise can protect against chronic diseases including T2DM and improve IR. Exercise is known to stimulate insulin sensitivity and alter lipid metabolism in the liver via lipid oxidation [6]. Previously, it was reported that regular exercise can reduce the hepatic fat content by 60% to 80%, resulting in improved insulin sensitivity in the liver [7]. Additionally, exercise can transiently decrease hepatic lipid levels by increasing fatty acid (FA) uptake and β-oxidation in muscles, and thus hepatic lipid storage can be reversed after prolonged exercise training (EX). Combined, previous studies suggest the beneficial effect of exercise on diacylglycerol (DAG) accumulation in the liver [3].
Additionally, besides exercise, nutritional interventions have been regarded as other non-therapeutic treatments for metabolic disorders [6]. Coffee, one of the most consumed beverages worldwide, has been introduced for its important source of antioxidants particularly due to the high amounts of phenolic compounds and caffeine [8]. Recently, green coffee (GC), an unroasted raw coffee bean, is being marketed as a popular dietary supplement for weight loss due to the hallmark that contains more chlorogenic acid (CGA) than any other roasted coffee [9]. GC contains seven distinctive hydroxycinnamic acid derivatives as CGA isomers, which constitute 10.4% of the total dry weight of GC products [10]. CGA is also a polyphenol and ester of caffeic and quinic acid which has been suggested to prevent ectopic lipid accumulation as well [11]. Previous in vitro studies presented that CGA can diminish lipid accumulation and CGA combined with caffeine can inhibit adipogenesis stronger than CGA or caffeine alone in 3T3-L1 cells [12,13]. In a current study, the role of CGA as a ligand to nuclear receptors that activate the metabolism of FAs has been proposed [14] and thus the authors propose that CGA could be a capable supplement to prevent obesity and dyslipidemia by lowering the total cholesterol (TC) synthesis and triacylglycerol (TG) levels in liver cells [15]. In animal studies, CGA has also been found to exert therapeutic effects on metabolic disorders, such as purifying extra FAs and increasing insulin sensitivity [16], helping to recover from metabolic disorders [17]. Together, previous data suggest the potential role of GC and/or CGA intake in preventing and/or treating metabolic disorders. Moreover, accumulated evidence that EX can exert metabolically beneficial effects also raises the possibility that combined treatments with EX and GC and/or CGA intake would be synergetic.
We have recently found that EX combined with GC or CGA can improve the symptoms and complications by regulating the glycogen synthesis mechanism [18]. However, there is still a lack of research evidence that EX and these nutritional treatments influence lipogenesis in pre-Diabetic liver, which is crucial in NAFLD. Therefore, as a preclinical in vivo investigation, we first aimed to investigate the potential therapeutic effects of GC and CGA intake and EX on HFD-induced lipogenesis in the setting of prediabetes conditions using a mouse model. The effects of GC or CGA supplementation paired with EX were compared to the effects of a singular treatment to determine a possible synergetic effect on hepatic lipid metabolism in the prediabetes stage. In addition, the effects between GC and CGA intake on prediabetes conditions were compared to assess whether the effects of GC are mainly ascribed to CGA.
METHODS
Detailed methods are available in the Supplementary Methods (Supplementary Table 1, Supplementary Fig. 1).
Animals
All mice were treated according to the recommendations of the Animal Ethics Committee of the Royan Institute and the protocol was approved by the Ethics Committee of the Royan Institute. Male C57BL/6 mice were treated with a normal diet (ND; 10% fat, 20% protein, 70% carbohydrate) or HFD (60% fat, 20% protein, 20% carbohydrate) for 12 weeks as the first stage. After the first stage, HFD-treated mice were divided into six groups and applied the following treatments for additional 10 weeks: no treatment (pre-D), GC intake, CGA intake, EX, GC+EX, and CGA+EX. Mice were fed with the same diet until the end of the study.
RESULTS
HFD during 12 weeks increased body weight (BW) in the pre-D group compared to the ND group (Table 1). This difference was further increased after additional 10 weeks (Supplementary Fig. 2A). All treatment groups, excluding GC, had a lower BW than the pre-D group, and the GC+EX group had the lowest BW. The pre-D group had a higher liver weight (LW) than the ND group, which was significantly lowered in the GC and CGA groups. These indicate that GC and CGA supplementation and EX could ameliorate a BW increase in response to HFD.

Differences in body weight, liver weight, liver to body weight ratio, and adipose tissue weight among groups
HFD consumption for the first 12 weeks increased fasting blood glucose (FBG) levels above the prediabetes threshold (100≤ IFG ≤125 mg/dL) (Supplementary Fig. 3). At the end of the second stage after additional 10 weeks, HFD mice (pre-D) had further increased FBG levels and area under the curve compared to the ND group (Fig. 1A, B and Supplementary Fig. 2B). Increased FBG levels in the pre-D group were accompanied by higher insulin levels and homeostatic model assessment for insulin resistance (HOMA-IR) index (Fig. 1A-D). Lipid profiles of the pre-D group also showed an increase in TC, TG, and low-density lipoprotein (LDL) levels compared to the ND group (Fig. 1E-G). Interestingly, high-density lipoprotein (HDL) levels were elevated in the pre-D group (Fig. 1H). Levels of alanine transaminase (ALT) and aspartate transaminase (AST), indicators of hepatic tissue damage, were also increased in the pre-D group compared to the ND group. However, these increases were alleviated by treatments (Fig. 1I and J). A significant reduction in FBG levels was found in all treatment groups compared to the pre-D group (Fig. 1A and B). In addition, all treatment groups showed a significant decrease in plasma insulin levels and HOMA-IR index compared to the pre-D group (Fig. 1C and D), demonstrating that all treatments mitigated HFD-induced prediabetes conditions in glucose profiles.
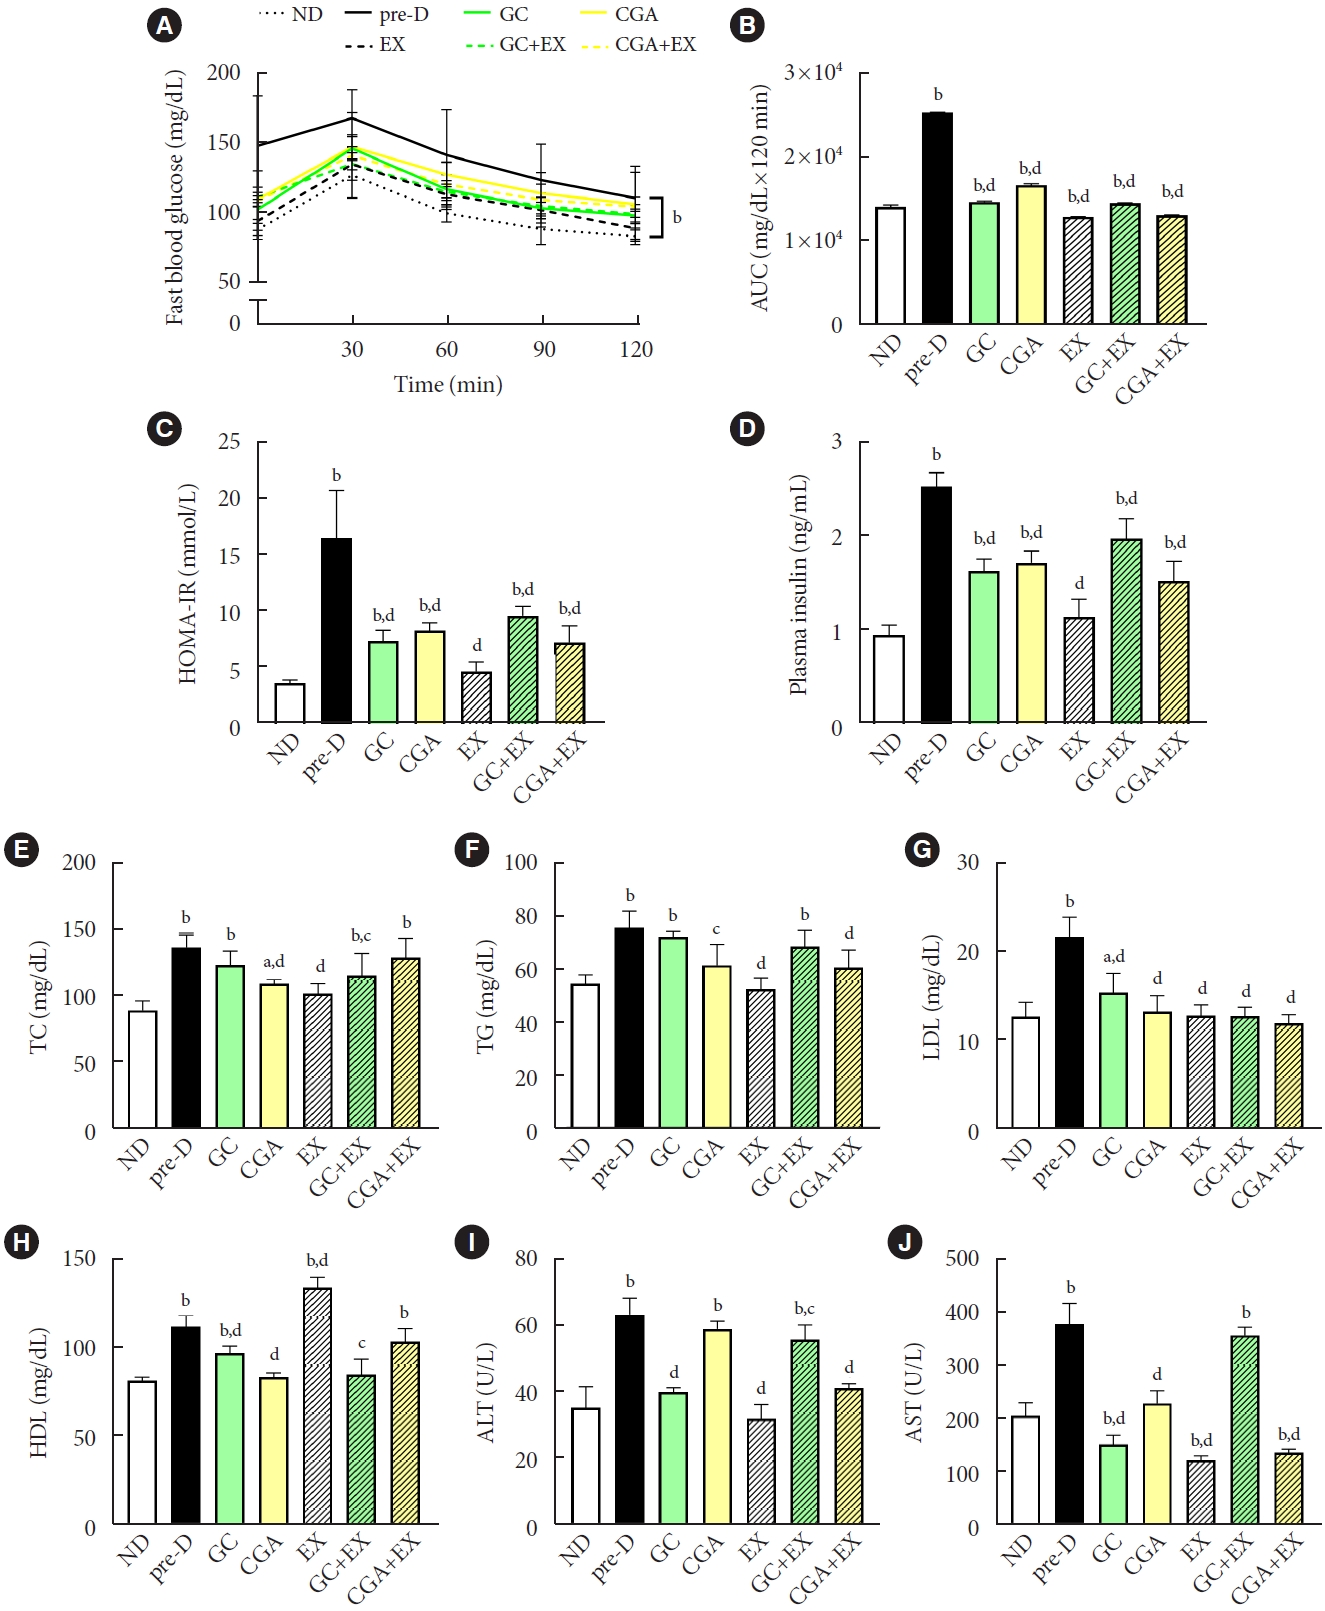
Treatments mitigated high-fat diet (HFD)-induced prediabetic phenotypes. At the first stage of the study, mice were treated with two different diets for the first 12 weeks: a normal diet (ND, n=7) and HFD (n=42). Then, in the second stage, HFD mice were further divided into six groups (n=7/group): no treatment (pre-D), treated with green coffee (GC), chlorogenic acid (CGA), exercise training (EX), GC+EX, and CGA+EX. Treatments were applied for 10 weeks under the same diet. At the end of the second stage (22nd week), (A) glucose tolerance test, (B) the area under the curve (AUC), (C) the homeostatic model assessment for insulin resistance (HOMA-IR) index, (D) plasma insulin, (E) total cholesterol (TC), (F) triglyceride (TG), (G) low-density lipoprotein (LDL), (H) high-density lipoprotein (HDL), (I) alanine transaminase (ALT), and (J) aspartate transaminase (AST) levels were assessed. aP<0.05 vs. ND, bP<0.01 vs. ND, cP<0.05 vs. pre-D, dP<0.01 vs. pre-D.
The lipid profiles showed a different pattern. For TC, CGA, EX, and GC+EX groups had a reduction compared to the preD group (Fig. 1E). TG levels were reduced in CGA, EX, and CGA+EX groups (Fig. 1F). LDL levels were lower in all treatment groups than in the pre-D group (Fig. 1G). As expected, HDL level in the EX-group was increased compared to the pre-D group. Notably, HDL levels were decreased in the GC, CGA, and GC+EX groups compared to the pre-D group (Fig. 1H). ALT and AST levels showed decreased levels in all treatment groups compared to the pre-D group (Fig. 1I and J). Furthermore, lipid accumulations were significantly higher in the livers from the pre-D group than from the ND group, and this increase was partially reduced in the livers from all treatment groups (Supplementary Fig. 4). These findings indicate that GC and CGA supplementation and EX can mitigate HFD-induced prediabetes conditions in circulating levels and fat accumulation in the liver. However, no synergistic effects of GC or CGA intake with EX were apparent. Additionally, the effects of GC and CGA intake on HFD-induced prediabetes conditions were similar, suggesting that the effects of GC would be primarily attributed to CGA effects in biochemical features.
The Gene Expression Omnibus (GEO) database was searched to identify candidate gene(s) possibly changed in response to HFD, GC treatment, and EX in the mouse liver. Based on analyzing data from GSE53131, 647, and 496 genes were identified to be up- and down-regulated, respectively, in response to HFD (Fig. 2A), while 256 and 160 genes were up- and down-regulated, respectively, by GC (Fig. 2B) (log fold change criteria >0.5 and false discovery rate <0.05). In addition, data from GSE104079 revealed that 1,351 and 1,611 genes were up- and down-regulated, respectively, by exercise (Fig. 2C). Acyl-CoA synthetase long chain family member 3 (Acsl3) was found to be a common gene among three different comparisons (Fig. 2D); up-regulation with HFD and down-regulation by GC and EX. Thus, this gene was chosen as a candidate gene, and assessed its gene and protein expression in this study. Oppositely to the anticipation by in silico analysis, Acsl3 gene expression was reduced in the pre-D group compared to the ND group, while this reduction was reversed in all treatment groups (Fig. 2E). A similar pattern for the ACSL3 protein was found (Fig. 2F), suggesting that acyl-CoA production was decreased by HFD, while this reduction was mitigated by GC and CGA supplementation and EX. However, no synergetic effects of combined treatments were not obvious.

Acyl-CoA synthetase long chain family member 3 (Acsl3) as a candidate gene is predicted to be differentially expressed with a high-fat diet (HFD), green coffee (GC), and/or exercise training (EX) in mouse livers and its responses to treatments. (A) Volcano plot showing differentially expressed genes with HFD compared to normal diet (ND) groups based on the data from GSE53131. (B) Volcano plot showing genes differentially expressed with GC intake in the setting of HFD based on the data from GSE53131. (C) Volcano plot showing differentially expressed genes with exercise compared to control groups based on the data from GSE104079. The red color represents the genes (|log fold change [FC]| >0.5 and false discovery rate [FDR] <0.5) significantly altered by each comparison. (D) The Venn diagram presents the distribution of significantly altered genes in three different comparisons. At the first stage of the study, mice were treated with two different diets for the first 12 weeks: a ND (n=7) and HFD (n=42). Then, in the second stage, HFD mice were further divided into six groups (n=7/group): no treatment (pre-D), treated with GC, chlorogenic acid (CGA), EX, GC+EX, and CGA+EX. Treatments were applied for 10 weeks under the same diet. At the end of the second stage (22nd week), Acsl3 gene (E) and protein (F) expression levels in the liver were measured using quantitative reverse transcription polymerase chain reaction and immunoblotting, respectively. 18s and β-actin were used to normalize gene and protein expression, respectively. aP<0.05 vs. ND, bP<0.01 vs. ND, cP<0.05 vs. pre-D, dP<0.01 vs. pre-D.
The expression of sterol regulatory element-binding protein 1C (Srebp-1c), a master gene in de novo lipogenesis (DNL), was elevated in the pre-D group compared to the ND group, while this elevation was attenuated in all treatment groups (Fig. 3A). Fatty acid synthase (Fasn) gene expression increased in the pre-D group compared to the ND group. However, no treatment mitigated this HFD-induced increase in Fasn gene expression (Fig. 3B). The expression of the acetyl-CoA carboxylase 1 (Acc1) gene, which encodes the first rate-limiting enzyme in DNL, was significantly increased in the pre-D group compared to the ND group. This increase was ameliorated in treatment groups, except for EX and CGA+EX groups (Fig. 3C). ACC1 protein expression was also higher in the pre-D group than in the ND group, however, treatment groups, excluding the GC group, had significantly reduced ACC1 protein expression compared to the pre-D group (Fig. 3D). These findings suggest that GC and CGA supplementation and EX can suppress HFD-induced activation of the DNL-related signals in the liver. Both gene and protein levels of glycerol-3-phosphate acyltransferase 1 (GPAT1) were significantly upregulated in the pre-D group compared to the ND group. These increases were alleviated by treatments with some exceptions (Fig. 3E and F), suggesting that HFD leads to increased hepatic TG production, which can be ameliorated by GC and CGA supplementation and EX. The effects of GC and CGA intake on DNL- and TG-producing signals in the setting of HFD were similar. This implies that the effects of GC are mainly attributed to CGA effects. GC or CGA intake combined with EX might not have synergetic effects.
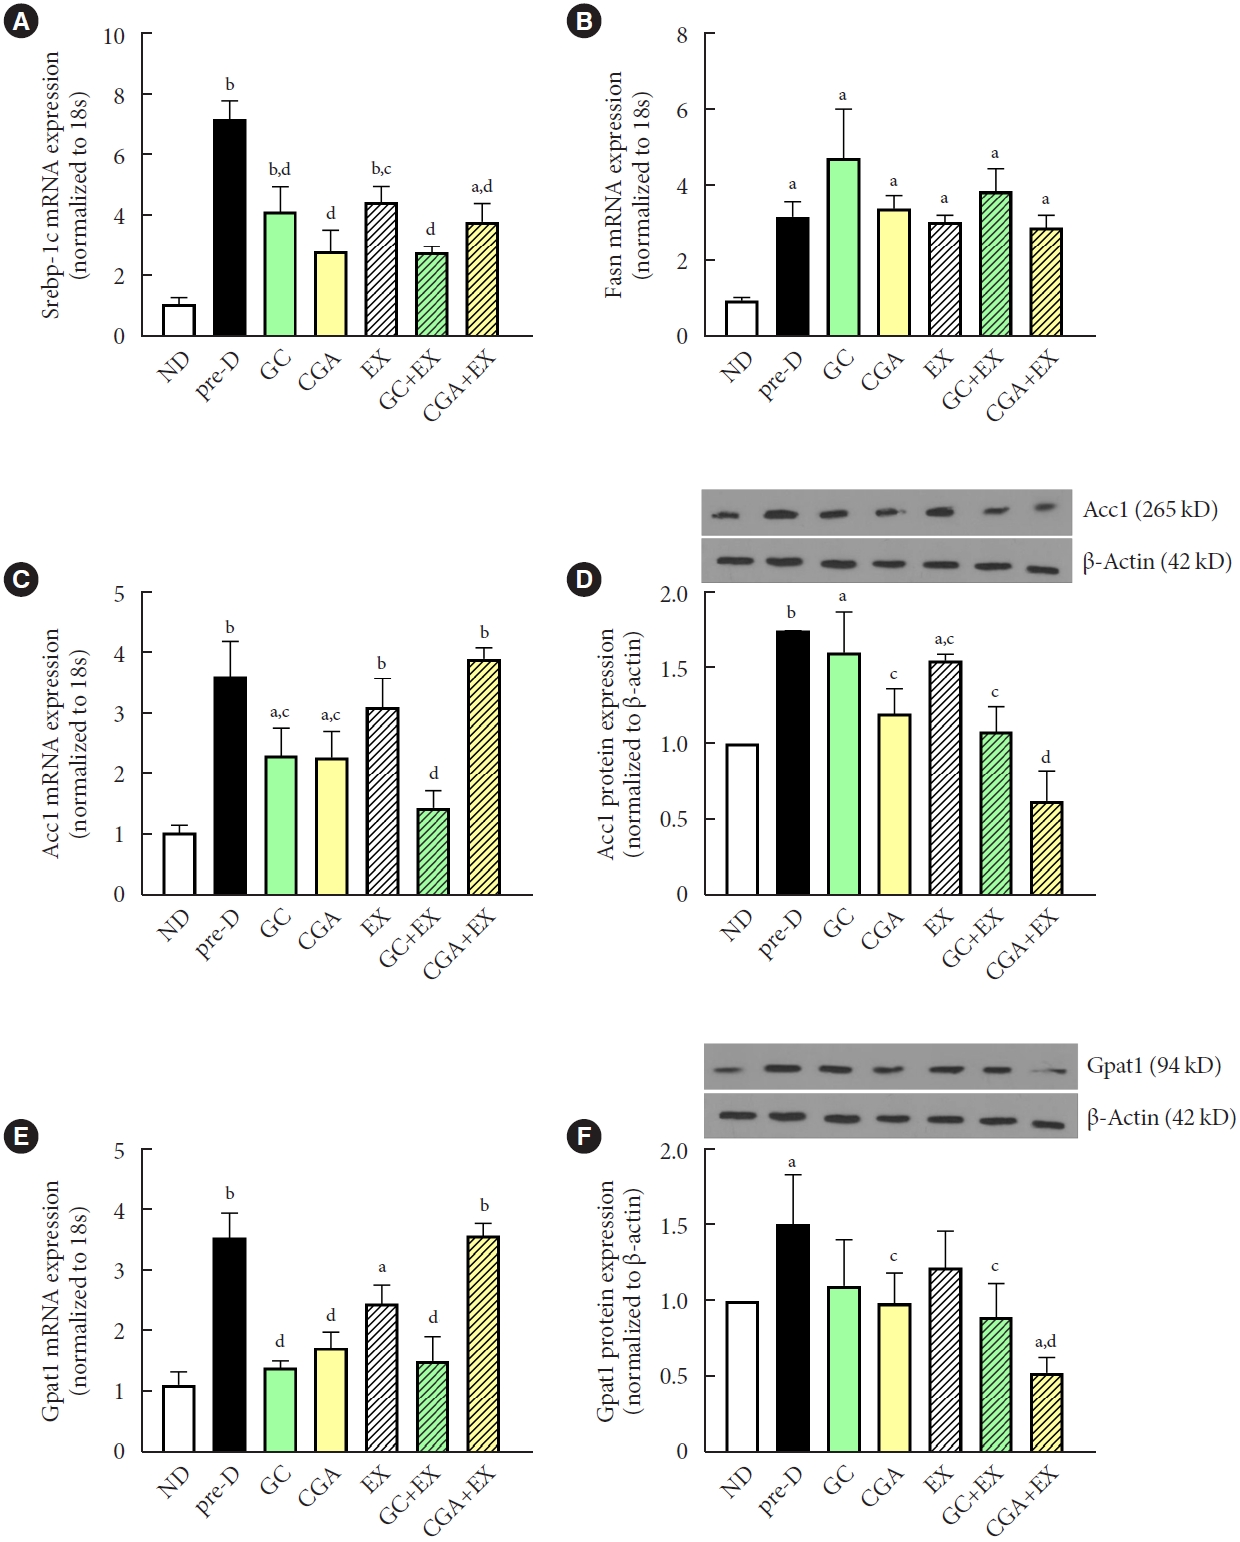
Treatments attenuated high-fat diet (HFD)-induced increases in triglyceride production in the liver. At the first stage of the study, mice were treated with two different diets for the first 12 weeks: a normal diet (ND, n=7) and HFD (n=42). Then, in the second stage, HFD mice were further divided into six groups (n=7/group): no treatment (pre-D), treated with green coffee (GC), chlorogenic acid (CGA), exercise training (EX), GC+EX, and CGA+EX. Treatments were applied for 10 weeks under the same diet. At the end of the second stage (22nd week), (A) sterol regulatory element-binding protein-1c (Srebp-1c), (B) fatty acid synthase (Fasn), (C) acetyl-CoA carboxylase 1 (Acc1), and (E) glycerol-3-phosphate acyltransferase 1 (Gpat1) gene expression levels in the liver were measured using quantitative reverse transcription polymerase chain reaction. (D) ACC1 and (F) GPAT1 protein expression levels in the liver were assessed by immunoblotting. 18s and β-actin were used to normalize gene and protein expression, respectively. aP<0.05 vs. ND, bP<0.01 vs. ND, cP<0.05 vs. pre-D, dP<0.01 vs. pre-D.
The expression level of peroxisome proliferator-activated receptor alpha (Ppar-α), a ligand-activated transcription factor involved in β-oxidation, was elevated in the pre-D group compared to the ND group, while this elevation was diminished in CGA, GC+EX, and CGA+EX groups (Fig. 4A). Acc2 gene expression was also upregulated in the pre-D group compared to the ND group, and the GC and CGA groups showed significantly reduced Acc2 gene expression levels compared to the pre-D group (Fig. 4B). However, all treatments exerted no effects on ACC2 protein levels, although the pre-D group had a higher ACC2 protein level than the ND group (Fig. 4C). Similarly, although carnitine palmitoyl transferase I (Cpt1) gene expression was upregulated in the pre-D group compared to the ND group, treatments showed minimal effects on Cpt1 gene expression (Fig. 4D). Interestingly, CPT1 protein expression showed a pattern opposite to Cpt1 gene expression in that CPT1 protein expression level was lower in the pre-D group than in the ND group and higher in all treatment groups than in the pre-D group (Fig. 4E). These results suggest that β-oxidation might be reduced with HFD, while GC and CGA supplementation and EX could mitigate a HFD-induced decrease in β-oxidation. No difference between GC and CGA intake implies that the effects of GC are mainly due to CGA effects. Meanwhile, the synergistic effect of combined treatment of GC or CGA supplementation with EX was not evident for β-oxidation signals.
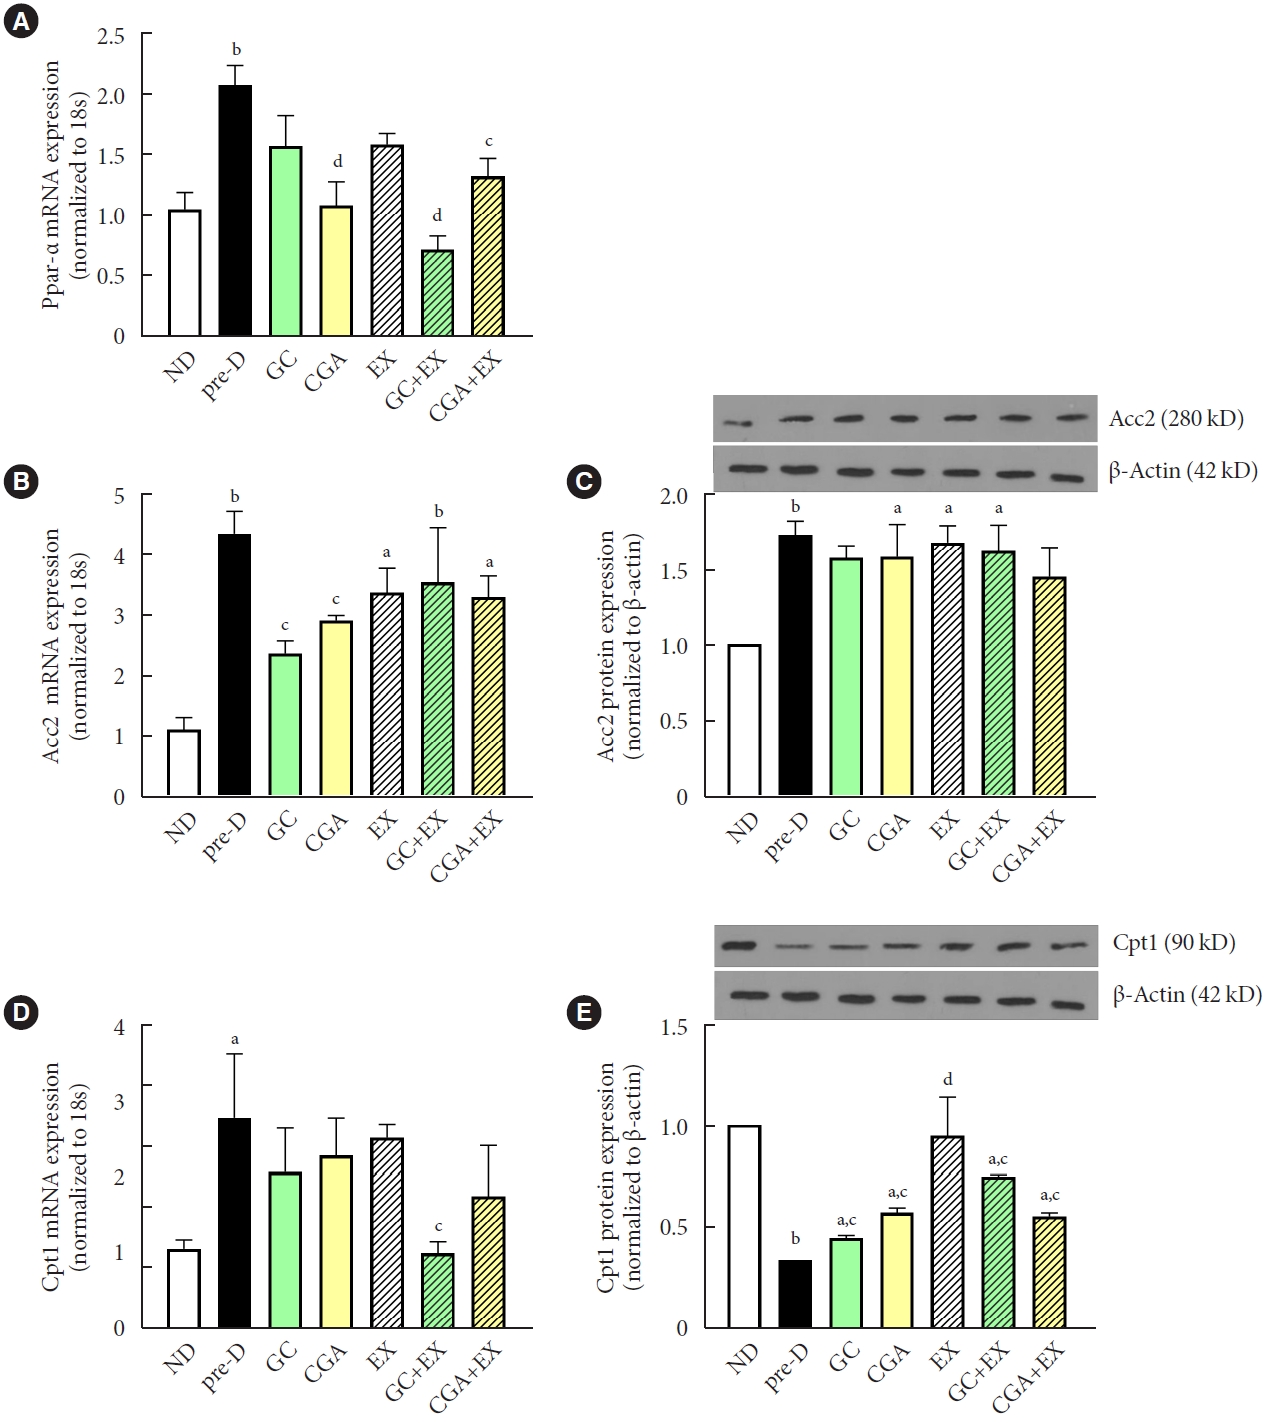
Treatments mitigated high-fat diet (HFD)-induced decreases in β-oxidation in the liver. At the first stage of the study, mice were treated with two different diets for the first 12 weeks: a normal diet (ND, n=7) and HFD (n=42). Then, in the second stage, HFD mice were further divided into six groups (n=7/group): no treatment (pre-D), treated with green coffee (GC), chlorogenic acid (CGA), exercise training (EX), GC+EX, and CGA+EX. Treatments were applied for 10 weeks under the same diet. At the end of the second stage (22nd week), (A) peroxisome proliferator-activated receptor alpha (Ppar-α), (B) acetyl-CoA carboxylase 2 (Acc2), and (D) carnitine palmitoyl transferase I (Cpt1) gene expression levels in the liver were measured using quantitative reverse transcription polymerase chain reaction. (C) ACC2 and (E) CPT1 protein expression levels in the liver were assessed by immunoblotting. 18s and β-actin were used to normalize gene and protein expression, respectively. aP<0.05 vs. ND, bP<0.01 vs. ND, cP<0.05 vs. pre-D, dP<0.01 vs. pre-D.
DISCUSSION
HFD and a sedentary lifestyle are risk factors for T2DM and NAFLD, which are associated with increased mortality [4]. Hepatic dysfunction is known to contribute to the development of metabolic disorders, emphasizing the pivotal role of the liver in energy metabolism [19]. HFD increases lipid accumulation in the liver which can contribute to hyperinsulinemia and NAFLD [2,3]. ACSL3, a member of the ACSL family in lipid droplets, is known to play a role in DNL in the liver [20]. DNL begins with ACC and FASN producing FAs [21]. A previous study showed that GPAT1 has a role in mediating DAG production in the liver as a source of IR, and DAG formed during DNL influences cell lipid content [22]. HFD is known to activate SREBP-1c-mediated GPAT1 gene expression [23]. Another important regulator of FAs is PPAR-α, which is a transcriptional factor for β-oxidation and CPT1 in the liver; upon activation, PPAR-α promotes β-oxidation, releasing FAs and thereby increasing acetyl-CoA production from lipids stored in the liver [24]. Therefore, activating β-oxidation and/or deactivating DNL could be effective in treating prediabetes.
In this study, HFD increased BW, FBG, and insulin levels, indicating that HFD causes prediabetes even in young male mice, while treatments demonstrated anti-HFD effects. As expected, EX diminished these increases. It is known that EX reduces insulin and FBG levels by elevating muscle glucose uptake and enhancing insulin sensitivity [18,25]. Consistently, EX shows the greatest effects on reducing FBG, HOMA-IR, and insulin levels among the treatments. As the prior studies suggested that GC or CGA consumption can influence lipid metabolism [9,17], this study provides further evidence supporting that GC and CGA can reduce lipid and glycemic complications under HFD consumption. One putative mechanism underlying GC and CGA effects could be the reduction in intestinal absorption of glucose via the CGA-associated inhibition of alpha-amylase, which ultimately can reduce the circulating insulin levels [26]. Therefore, further studies are warranted to elucidate this mechanism.
Lipid profiles were increased in the pre-D group compared to the ND group, while these increases were ameliorated by GC and CGA supplements and EX. LDL level was reduced by treatments up to the levels of the ND group, suggesting that GC and CGA supplements and EX can help reduce lipid profiles. These results could be associated with the effect of EX on proteinase subtilisin kexin 9 (PCSK9) modulation in that the inhibition of PCSK9 increases LDL absorption through its receptor [27]. Moreover, it was proposed that GC and CGA can ameliorate TC, TG, and LDL levels through the regulation of glucose transporter type 4 (GLUT4) in peripheral tissues, inhibition of intestinal α-amylase, increased hepatic glucokinase activity, inhibition of glucose 6-phosphatase, and increased transmission of glucose to adipose tissue [28], thus possibly lowering cholesterol levels. Measurements of lipid accumulation in the liver are also in line with the results of the circulating level, further supporting that HFD-associated increases in lipids could be partially prevented by GC and CGA supplements and/or EX. Notably, the pre-D group showed an increase in HDL levels. A previous study has also shown that HFD can increase HDL levels by increasing the transport rates and decreasing the fractional catabolic rates of HDL [29]. The EX group showed an increase in HDL levels similar to previous data that EX can increase lecithin–cholesterol acyltransferase, leading to increased cholesterol in HDL and thereby increasing circulating HDL [30]. Interestingly, GC and CGA supplementation significantly decreased HDL levels, even when combined with EX. A previous study has shown that CGA operates through the pro-atherogenic pathway of cholesterol metabolism [31], implying that GC or CGA could counteract the HDL-stimulating effect of exercise. Although lipid accumulation in the liver was increased in the pre-D group and diminished in all treatment groups, LW and LW to BW ratio were not exactly matched. It is likely that decreased LW and LW to BW ratio in CGA and GC, but not when combined with exercise (GC+EX and CGA+EX), might be associated with the increase in FAs synthesis due to GC caffeine or “athletic paradox” [32,33].
Given the relationship between lipid accumulation and AST and ALT levels via elevated reactive oxygen species (ROS) production [34], it can be speculated that an increase in ALT and AST levels in the pre-D group is associated with increased ROS accompanied by increased BW and adipose tissue weight [35] in the pre-D group. It can be further supported by the finding that the EX group had the lowest adiposity and AST and ALT levels. Previously, an antioxidant role of GC and CGA via their hydroxyl groups has been proposed [10]. The findings that increased AST and ATL levels with HFD were diminished by GC and CGA also support the antioxidant roles of GC and CGA.
In silico analysis of repository data revealed that Acsl3 is a candidate gene that is possibly up-regulated by HFD and down-regulated with GC and EX in the mouse liver. ACSL3 is also known to play a critical role in lipid metabolism as ACSL enzymes are important for β-oxidation and lipid synthesis through FA activation [20]. In this study, our results are unexpectedly opposite in that both gene and protein expression of ACSL3 were significantly decreased by HFD and treatments partially reversed this HFD effect. This inconsistency could be due to several reasons, such as diverse metabolic disease states (diabetes vs. prediabetes), diet (fasting vs. HFD), and training intensity/duration. For example, for the database of GSE104079, array data from fasted control mice and fasted-EX mice were compared. To our knowledge, this is the first time to provide that decreased ACSL3 gene and protein expression were ameliorated by GC and CGA supplementation and EX in the mouse liver. Further supported by previous findings that an increase in FAs leads to a decrease in ACSL3 expression [36,37], additional studies elucidating the mechanisms by which GC and CGA supplementation and EX activate ACSL3 are warranted.
IR plays a pivotal role in NALFD via DNL which is highly prevalent in individuals with T2DM [38]. In this study, HFD activated SREBP-1C, an initiator, and ACC1, a rate-limiting enzyme, which are known to facilitate malonyl-CoA that FASN produces palmitate, in the DNL process [23]. Similarly, the upregulation of Srebp-1c, Acc1, and Fasn was observed in the pre-D group and this was in line with an increase in BW and lipid profiles. These changes were mitigated with GC and CGA supplementation and EX. Notably, Fasn expression was not influenced by treatments despite an upregulation with HFD. Fasn expression tends to be even higher in the GC group than in the pre-D group, implying the caffeine effect in GC as discussed in a previous study that caffeine leads to an increase in Fasn gene expression [32]. Unfortunately, FASN protein expression was not assessed in this study.
GC and CGA supplementations reduced Acc1 gene expression, while EX did not change Acc1 gene expression in the setting of HFD. This would be associated with a reduction in entering FAs into the hepatic cells since long-term EX increases the consumption of FAs as the main energy source [39]. GPAT1 directs FAs to TG synthesis on the cytosolic surface of the mitochondrial external membrane and endoplasmic reticulum [23]. GC and CGA supplementation significantly reduced GPAT1 levels and this finding is in line with a reduction in TG levels.
PPAR-α is known to regulate the expression of key β-oxidation enzymes, including CPT-1 [40]. A significant increase in Ppar-α gene expression in response to HFD was found as previously observed [41] and this could be explained by FA production in hepatic cells by the FASN enzyme as it may act as a PPAR-α ligand [42]. ACC2 is located in the outer membrane of mitochondria and catalyzes the carboxylation of acetyl-CoA to form malonyl-CoA, an intermediate that inhibits the activity of CPT1 [43]. Thus, the inhibition of ACC2 results in enhanced oxidation of lipids [44]. In this study, HFD enhanced ACC2 expression at both gene and protein levels, while treatments, particularly EX, showed minimal effects on the changes in ACC2. Similarly, this would be associated with increased FAs usage during exercise. Notably, CPT1 gene and protein expression patterns were opposite, raising the potential mechanisms of mRNA half-life, stability of mRNA, and post-transcriptional regulation [45,46], although this study does not provide supporting evidence.
We previously found that exercise combined with GC or CGA was effective in the production of glucose and glucose accumulation by controlling the genes involved in glucose metabolism [18]. However, in the present study, CG or CGA supplementation paired with EX exerts no synergistic effects on HFD-induced lipid complications compared to a single treatment. It can be speculated that the maximal benefit was achieved by a single treatment; therefore, there was no capacity to be improved further even with additional stimulation (denoted as “the ceiling effect”). Otherwise, the antagonistic interactions of two independent treatments together could be exerted. Despite improved glucose and lipid metabolism in the treatment groups compared to the pre-D group, the treatment groups still had higher or lower levels than the ND group. This emphasizes that eating less fat is the most important strategy in preventing glycemic and lipid complications. In addition, the GC group had similar results to the CGA group, and the CGA group tended to have better effects than GC in most cases, demonstrating that the beneficial effects of GC might be mainly due to CGA.
Some of the other health benefits from CGA supplementation with exercise have been proposed earlier, such as anti-fatigue activity by alleviating oxidative stress and improving muscle structure [47]. CGA is also proposed to improve the rate of strength recovery after exercise [48] and exert positive effects on skeletal muscle mitochondria as a new mechanism to induce an increase in muscle strength and performance [49]. Therefore, further studies examining the effect of GC and CGA supplementation with or without EX on physical function focusing on muscle quality and function will be interesting.
In brief (Fig. 5), GC and CGA supplementation and EX reversed or ameliorated HFD-induced prediabetes along with the adverse alterations in blood glucose profiles, lipid profiles and accumulation, and DNL- and β oxidation-associated molecules in the mouse liver. The exercise group showed the greatest beneficial effect; however, GC or CGA supplementation paired with EX did not exert a synergistic effect in most cases. The CGA group tended to have similar or better results than the GC group, suggesting that CGA can be a single supplement to help glucose and lipid hemostasis in the liver at the prediabetes stage. Together, these preclinical findings suggest that regular exercise is an effective non-therapeutic strategy to prevent prediabetes and CGA supplementation is recommended to partially mimic the beneficial effects of exercise on prediabetes conditions.
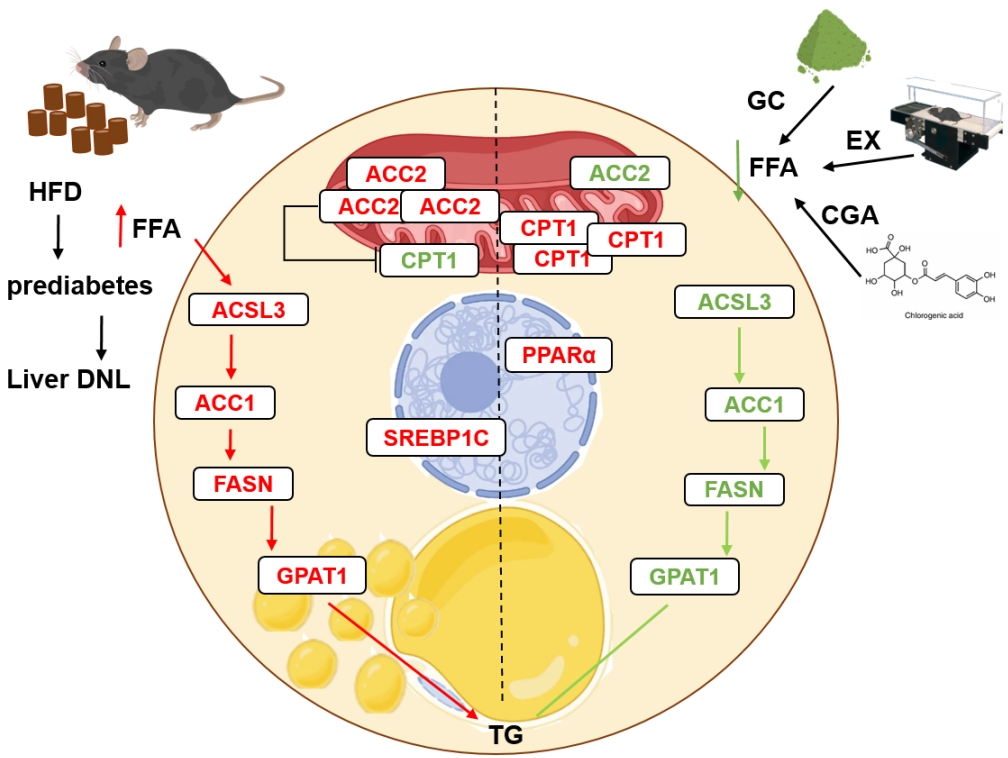
Graphical abstract. A prediabetic hepatic cell representing de novo lipogenesis (DNL) (left) associated with a high-fat diet (HFD) and the preventive effects of treatments (right). HFD elevates plasma free fatty acids (FFAs) which enter hepatic cells and contribute to the activation of acyl-CoA synthetase (ACSL) known to convert fatty acids (FAs) into fatty acyl-CoAs. Acyl-CoAs then proceed with de novo lipogenesis (acetyl-CoA carboxylase 1 [ACC1]) and/or β-oxidation inhibition (ACC2). Consequently, with the involvement of fatty acid synthase (Fasn) and glycerol-3-phosphate acyltransferase 1 (GPAT1), triglyceride (TG) can be formed. In this study, lipogenic molecules were found to increase with HFD (red color) which can lead to an increase in lipid droplets inside the cell owing to increased TG production (left). However, exercise training (EX), green coffee (GC), and chlorogenic acid (CGA) treatments mitigated HFD-induced changes in the lipogenic molecules (green color). Thus, β-oxidation via carnitine palmitoyl transferase I (CPT1) can be increased, and FA levels and the lipid droplet size inside the hepatic cell can be decreased.
SUPPLEMENTARY MATERIALS
Supplementary materials related to this article can be found online at https://doi.org/10.4093/dmj.2022.0366.
SUPPLEMENTARY METHODS
Supplementary Table 1.
Primer sequences of genes used to perform quantitative reverse transcription polymerase chain reaction
Supplementary Fig. 1.
High-performance liquid chromatography of chlorogenic acids in green coffee bean extract.
Supplementary Fig. 2.
High-fat diet (HFD) induced prediabetes in male mice at the first and second stages of the study. In the first stage, mice were treated with two different diets: a normal diet (ND, n=7) or HFD (n=42) for 12 weeks. Then, in the second stage, mice were further treated with the same diet for additional 10 weeks (n=7/group). (A) Body weight (BW) was recorded at 0, 12 (the end of the first stage), and 22 weeks (the end of the second stage). (B) The area under the curve (AUC) measured by the glucose tolerance test was calculated at the end of each stage. pre-D, no treatment. aP<0.01 vs. diet-matched mice of week 0, bP<0.01 vs. age-matched ND, cP<0.01 vs. diet-matched mice of week 12.
Supplementary Fig. 3.
High-fat diet (HFD) for 12 weeks as the first stage of the study induced prediabetes in male mice. Mice were treated with two different diets: a normal diet (ND, n=7) or HFD (n=42). (A) Glucose tolerance test was conducted and (B) the area under the curve (AUC) was calculated at the end of the first stage. aP<0.01 vs. ND.
Supplementary Fig. 4.
Treatments attenuated high-fat diet (HFD)-induced increases in fat accumulation in the fat. At the first stage of the study, mice were treated with two different diets for the first 12 weeks: a normal diet (ND) and HFD. Then, in the second stage, HFD mice were further divided into six groups: no treatment (pre-D), treated with green coffee (GC), chlorogenic acid (CGA), exercise training (EX), GC+EX, and CGA+EX. Treatments were applied for 10 weeks under the same diet. At the end of the second stage (22nd week), the liver was obtained. The liver was stained with (A) oil red O and (B) lipid droplets were quantified (n=3–4 per group). aP<0.05 vs. ND, bP<0.01 vs. ND, cP<0.01 vs. pre-D.
Notes
CONFLICTS OF INTEREST
No potential conflict of interest relevant to this article was reported.
AUTHOR CONTRIBUTIONS
Conception or design: all authors.
Acquisition, analysis, or interpretation of data: S.S., S.M.M., S.K.K.
Drafting the work or revising: S.S., S.M.M., S.K.K.
Final approval of the manuscript: all authors.
FUNDING
This study was supported by the Research Program funded by SeoulTech (Seoul National University of Science and Technology).
Acknowledgements
None