
- Current
- Browse
- Collections
-
For contributors
- For Authors
- Instructions to authors
- Article processing charge
- e-submission
- For Reviewers
- Instructions for reviewers
- How to become a reviewer
- Best reviewers
- For Readers
- Readership
- Subscription
- Permission guidelines
- About
- Editorial policy
Articles
- Page Path
- HOME > Diabetes Metab J > Volume 42(3); 2018 > Article
-
Original ArticleComplications Higher Prevalence and Progression Rate of Chronic Kidney Disease in Elderly Patients with Type 2 Diabetes Mellitus
-
Kyung-Soo Kim, Seok Won Park, Yong-Wook Cho, Soo-Kyung Kim

-
Diabetes & Metabolism Journal 2018;42(3):224-232.
DOI: https://doi.org/10.4093/dmj.2017.0065
Published online: May 31, 2018
Department of Internal Medicine, CHA Bundang Medical Center, CHA University School of Medicine, Seongnam, Korea.
- Corresponding author: Soo-Kyung Kim. Department of Internal Medicine, CHA Bundang Medical Center, CHA University School of Medicine, 59 Yatap-ro, Bundang-gu, Seongnam 13496, Korea. imdrksk@cha.ac.kr
Copyright © 2018 Korean Diabetes Association
This is an Open Access article distributed under the terms of the Creative Commons Attribution Non-Commercial License (http://creativecommons.org/licenses/by-nc/4.0/) which permits unrestricted non-commercial use, distribution, and reproduction in any medium, provided the original work is properly cited.
ABSTRACT
-
Background
- To evaluate the prevalence of chronic kidney disease (CKD) and progression rate to CKD in elderly patients with type 2 diabetes mellitus (T2DM).
-
Methods
- We investigated the medical records of 190 elderly patients (65 years or older) with T2DM from 2005 to 2011 in 6-month increments. Mean follow-up duration was 64.5 months. CKD was defined as estimated glomerular filtration rate (eGFR) <60 mL/min/1.73 m2 and/or the presence of albuminuria.
-
Results
- The mean age was 70.4 years and mean diabetes duration was 10.6 years. Among all the participants, 113 patients (59.5%) had CKD. The eGFR was significantly decreased between baseline (65.7±15.0 mL/min/1.73 m2) and the end of follow-up (52.7±17.5 mL/min/1.73 m2, P<0.001). At the end of follow-up, the prevalence of eGFR <60 mL/min/1.73 m2 had increased by 61.6% (at baseline, 44.2%). Furthermore, in patients with eGFR ≥60 mL/min/1.73 m2, the progression rate to more than CKD stage 3 was 39.6% at the end of follow-up; 30.2% of elderly diabetic patients had progressed to albuminuria from normoalbuminuria. Kaplan-Meier analysis showed that the time interval to worsening nephropathy was significantly shorter in elderly patients with diabetes duration ≥10 years than in those with diabetes duration <5 years (P=0.018).
-
Conclusion
- CKD was commonly observed in older patients with T2DM, and the progression rate to CKD is also high. Consequently, it is important to identify and manage CKD as early as possible in elderly patients with T2DM, especially in those with diabetes duration ≥10 years.
- Chronic kidney disease (CKD) is a global public health problem, and its prevalence is gradually increasing, mainly due to an increase in the number of patients with type 2 diabetes mellitus (T2DM) [123]. CKD develops in approximately 35% of patients with T2DM and is associated with increased mortality [456]. In addition, CKD is one of several conditions that are common in older people and are associated with an increased risk of cardiovascular disease [678]. Because renal function declines naturally with aging, CKD develops more frequently in older people [910]. According to data from the Korean National Health and Nutrition Examination Survey in 2005 and 2007, CKD prevalence reached 22.6% in participants aged 60 to 74 years and 44.5% in those aged 75 years or more [11]. Furthermore, elderly patients with T2DM have higher CKD prevalence than those without T2DM [12131415]. The prevalence of CKD in older diabetic patients (aged ≥65 years) increased from 27.3% between 1988 and 1994 to 40.6% between 2009 and 2014, based on the National Health and Nutrition Examination Survey (NHANES) [14]. A Spanish study has shown that CKD prevalence in older patients with T2DM (mean age, 67.9 years) controlled in primary care was 34.6% [15].
- Well-documented risk factors for CKD are advanced age, obesity, hypertension, and fasting glucose in patients with T2DM [16171819]. However, most previous studies were not conducted in the older population. Older patients with T2DM have a high risk of CKD not only because of their age but also because they have diabetes [16202122]. Therefore, older diabetic patients without CKD have a higher risk of progression to CKD than do young patients. Nevertheless, there is limited data on the prevalence of CKD and progression rate to CKD in older patients with T2DM. The aim of this study is to evaluate the prevalence of CKD and the progression rate to CKD in older patients with T2DM.
INTRODUCTION
- Participants and design
- A retrospective cohort study was conducted by reviewing the medical records of older patients with T2DM who visited the diabetes clinic at the CHA Bundang Medical Center, Seongnam, Korea. The study population included T2DM patients ≥65 years of age who had an estimated glomerular filtration rate (eGFR) ≥30 mL/min/1.73 m2. We included the patients who had visited the clinic at least one time every 6 months from the baseline visit. Baseline visit period was from January 1, 2005, to December 31, 2005. We excluded subjects who had type 1 diabetes mellitus (T1DM), acute disease, known inherited kidney diseases, cancer, or acute renal failure caused by other circumstances (for example, drug use, contrast media, and so on). Follow-up ended on December 31, 2011, or earlier if either death or follow-up loss occurred. Among 433 older patients with T2DM, we enrolled 190 patients who visited regularly after the baseline visit. Both at baseline and at follow-up, anthropometric assessments, blood pressure, and laboratory tests were reviewed in all study participants. During the study, eGFR was calculated using the modification of diet in renal disease (MDRD) Study equation every 6 months. This study was approved by the CHA University Institutional Review Board (2016-12-041), and informed consent was obtained from all study participants.
- Measurements and definitions
- Body weight and height were measured in participants wearing a hospital gown and without shoes on a calibrated balance beam scale and stadiometer, respectively. Blood pressure was measured using a mercury sphygmomanometer while the subjects were seated. All blood samples were obtained after an overnight fast of at least 8 hours, and fasting plasma glucose, total cholesterol, triglyceride, high density lipoprotein cholesterol, and creatinine levels were measured. Albuminuria was assessed only once in a spot morning urine sample. Glycosylated hemoglobin (HbA1c) was analyzed using high-performance liquid chromatography (Variant II; Bio-Rad, Hercules, CA, USA).
- CKD staging was done according to the Kidney Disease Outcomes Quality Initiative guidelines of National Kidney Foundation [23]. Stages of CKD were defined as follows: stage 1 (eGFR ≥90 mL/min/1.73 m2); stage 2 (eGFR 60 to 89 mL/min/1.73 m2); stage 3 (eGFR 30 to 59 mL/min/1.73 m2); stage 4 (eGFR 15 to 29 mL/min/1.73 m2); and stage 5 (eGFR <15 mL/min/1.73 m2). Albuminuria was defined by the urinary albumin-to-creatinine ratio as microalbuminuria (30 to 300 mg/g Cr) or macroalbuminuria (>300 mg/g Cr). CKD was defined as eGFR <60 mL/min/1.73 m2 and/or the presence of albuminuria.
- The renal outcome was worsening nephropathy, defined as death from renal disease; the initiation of renal-replacement therapy; progression to macroalbuminuria; or a doubling of the serum creatinine level, accompanied by an eGFR of <45 mL/min/1.73 m2; or worsening of CKD stage at the end of follow-up than at baseline.
- Statistical analysis
- Data for continuous variables is presented as mean±standard deviation, and categorical factors are reported as percentages. The significance of differences in measurements among groups was tested using the independent sample t-test, paired t-test, or Mann-Whitney U test for continuous measures and chi-square tests for categorical measures. The odds ratio and 95% confidence interval were calculated using logistic regression analysis with or without adjustment for age, sex, body mass index (BMI), hypertension, diabetes duration, and HbA1c. Kaplan-Meier analysis and the log rank test were used to compare the difference in cumulative renal survival. A P<0.05 was considered significant. All statistical analyses were performed using IBM SPSS Statistics version 19.0 (IBM Co., Armonk, NY, USA).
METHODS
- The baseline characteristics of the study population according to the presence of CKD are presented in Table 1. Among the 190 elderly patients with T2DM, 113 patients (59.5%) had CKD at baseline. The mean age was 70.4 years and mean diabetes duration was 10.6 years. Although the average duration of diabetes was longer in patients with CKD than in those without CKD, mean HbA1c was not different in both groups.
- Duration of diabetes was the independent risk factor for CKD in older patients with T2DM (Table 2). Age, sex, BMI, hypertension, and HbA1c were not associated with the presence of CKD in these patients. After adjustment for age, sex, BMI, hypertension, diabetes duration, and HbA1c, longer duration of diabetes was still associated with CKD.
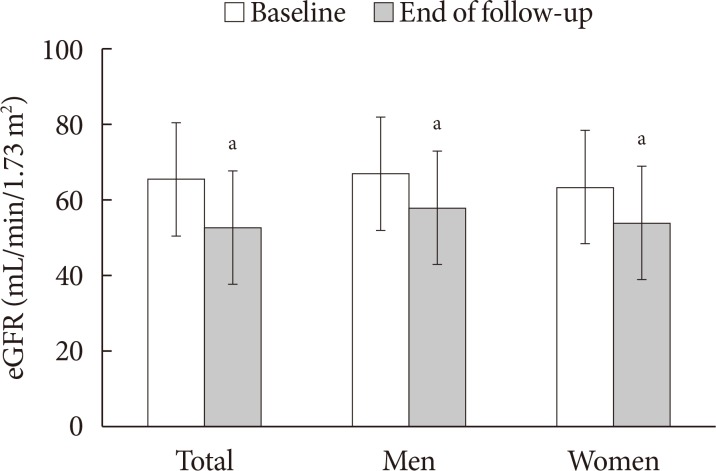
- Mean follow-up duration was 64.5 months, and eGFR significantly declined between baseline (65.7±15.0 mL/min/1.73 m2) and the end of follow-up (52.7±17.5 mL/min/1.73 m2, P<0.001) (Fig. 1). The annual rate of GFR decline was 2.42 mL/min/1.73 m2. Table 3 shows the transition for the stage of CKD from baseline to the end of follow-up. At the end of follow-up, the prevalence of eGFR <60 mL/min/1.73 m2 had increased by 61.6% (117/190; at baseline, 44.2% [84/190]). The stage of CKD was aggravated in one-third of patients (31.6%, 60/190). Furthermore, in patients with eGFR ≥60 mL/min/1.73 m2, the progression rate to more than CKD stage 3 was 39.6% (42/106) at the end of follow-up. In addition, 30.2% (29/96) of older diabetic patients had progressed to albuminuria from normoalbuminuria (Table 4). The progression rate to macroalbuminuria was 4.7% (7/148) in older patients with T2DM at the end of follow-up.
- Worsening nephropathy presented in 39.5% (75/190) of older diabetic patients; death from renal disease (n=11); the initiation of renal replacement therapy (n=4); progression to macroalbuminuria (n=7) or a doubling of the serum creatinine level, accompanied by an eGFR of <45 mL/min/1.73 m2 (n=9); worsening of CKD stage at the end of follow-up than at baseline (n=60) all also occurred. Kaplan-Meier analysis showed that the time interval to worsening nephropathy was significantly shorter in older patients with diabetes duration ≥10 years than in those with diabetes duration <5 years (diabetes duration <5 years vs. ≥10 years, P=0.018) (Fig. 2). Sex, the presence of obesity or hypertension, and HbA1c level were no different for cumulative renal survival among older diabetic patients.
RESULTS
- Increased life expectancy and a higher T2DM incidence lead to an increase in the number of older diabetic patients with CKD [123]. In patients with T2DM, CKD significantly increases cardiovascular morbidity and mortality, and it is the main reason for renal replacement therapy [45678910]. Despite the high number of older diabetic patients with CKD, few studies have investigated the prevalence of CKD and progression rate to CKD in this population. In this study, we show that CKD was commonly observed in older patients with T2DM, and the progression rate to CKD was also high. Furthermore, older diabetic patients with diabetes duration ≥10 years had a high risk for worsening nephropathy.
- The prevalence and incidence of CKD in patients with T2DM have increased over the past two decades. The prevalence of CKD was 19.8% in participants aged 65 years or older, and it is very high compared with 0.7% in those aged 35 to 44 years in urban Korea [18]. In Taiwan, an observational cohort study reported that 39.4% of older patients had CKD, stage 3 to 5 [24]. The mean age was 75.7 years, and only 30.8% of them had hyperglycemia. We could presume that older patients with diabetes develop higher CKD prevalence than those without diabetes. Comparatively, CKD prevalence was 30.3% in diabetic patients aged 30 years or more and 39.0% in those aged 65 years or more in Korea [25]. According to the data from NHANES, the prevalence of CKD in older diabetic patients (aged ≥65 years) increased from 27.3% between 1988 and 1994 to 40.6% between 2009 and 2014 [14]. In this data, the prevalence of patients who had diabetes duration ≥10 years also increased from 23.6% between 1988 and 1994 to 37.7% between 2009 and 2014 even though this prevalence was calculated in all age groups. In present study, the prevalence of CKD was 59.5% in older patients with T2DM (mean age, 70.4 years). The reason a higher CKD prevalence was observed than in previous studies might be that this study included many older diabetic patients who already had diabetes longer than 10 years at baseline. Although our study sample was not large and representative of the general Korean population, we could know that CKD was commonly observed in older patients with T2DM.
- In general, the progression rate to CKD is slow, although there is a high prevalence of CKD in older patients [2627]. In an observational study including 4,562 patients older than 65 years at US Veterans Affairs health care facilities, only 44% of the patients progressed at a rate of 1 to 4 mL/min/1.73 m2 per year [28]. In another study, the annual rate of GFR decline was only 0.8 to 1.4 mL/min/1.73 m2 in nondiabetic patients older than 65 years [29]. However, there are few studies of the progression rate to CKD in older patients with T2DM. In this study of older diabetic patients, eGFR declined at a rate of 2.42 mL/min/1.73 m2 per year among all participants, and the stage of CKD was aggravated in one-third of patients (31.6%, 60/190). In addition, in patients with eGFR ≥60 mL/min/1.73 m2, the progression rate to more than CKD stage 3 was 39.6% (42/106) at the end of follow-up; 30.2% (29/96) of older diabetic patients progressed to albuminuria from normoalbuminuria. Compared to the slow progression to CKD in nondiabetic older patients, the faster decline of renal function would be due to T2DM. This is important because when we manage older patients with T2DM, we should pay attention to their renal function.
- Old age, obesity, hypertension, and diabetes mellitus are traditional risk factors for CKD [16171819]. In this study, longer diabetes duration was an independent factor related to the presence of CKD in older diabetic patients. Furthermore, diabetes duration ≥10 years was still associated with worsening nephropathy at the end of follow-up. No similar study was conducted with older diabetic patients, but cumulative incidence of kidney complications such as macroalbuminuria and end-stage renal disease increased with longer duration of diabetes during a 25-year follow-up of patients with T1DM [30]. In addition, being diagnosed with T1DM before 6 years of age carries a lower risk of kidney disease development, but this relationship diminished with longer diabetes duration. It is not certain, but we could assume that longer duration of diabetes accumulates renal damage regardless of glucose level.
- Interestingly, HbA1c is not associated with CKD at baseline and worsening nephropathy at the end of follow-up. In the UK Prospective Diabetes Study, a modest decrease in HbA1c over 10 years from 7.9% to 7.0% lowered the risk of microvascular endpoints, reducing the onset of microalbuminuria by 25% [31]. However, the study population was younger patients with newly diagnosed T2DM (mean age, 54 years). Until now, there have been no long-term randomized studies that show the benefits of intensive blood glucose control in the older population. Because the benefit of controlling blood glucose for CKD and its progression would be greater in those younger and recently diagnosed with T2DM than in older patients with T2DM [10], HbA1c difference would not have influenced CKD and its progression in this study (mean age, 70.4 years; mean diabetes duration, 10.6 years at baseline). Old age and T2DM itself are strong risk factors for CKD, so the difference might not appear to depend on HbA1c.
- In addition, hypertension is also not associated with CKD at baseline and worsening nephropathy at the end of follow-up. One possible explanation is that angiotensin-converting enzyme inhibitor (ACEI) or angiotensin II receptor blocker (ARB) has been used more than in other studies. Compared to 24.4% of older diabetic patients who have used ACEI or ARB between 1988 and 1994 and 56.2% between 2009 and 2014 according to the data from NHANES [14], 61.6% of patients in this study have used ACEI or ARB. Another possible reason would be that over 70% of patients already had hypertension, so it would not have influenced CKD and its progression.
- Renal blood flow and GFR would be diminished by time [32]. Pathologically, the aging kidney may be associated with changes in basement membrane thickening and mesangial expansion [3]. In addition, because they commonly have age-related, coexisting conditions such as vasculitis, amyloidosis, and atherosclerotic disease, older persons tend to high risk for CKD [9]. The mechanism of the progression to CKD in patients with diabetes is still controversial. Hyperactivity of the renin-angiotensin-aldosterone (RAS) system, osmotic sodium retention, endothelial dysfunction, dyslipidemia, RAS/RAF/extracellular-signal-regulated kinase pathway, modification of the purinergic system, phosphatidylinositol 3-kinase (PI 3-kinase)–dependent signaling pathways, and inflammation were possible pathways that have been identified so far [33]. Without doubt, however, aging and T2DM are strong risk factors for deterioration of renal function.
- The therapeutic strategy for T2DM in older patients should consider CKD, which is a major prognostic factor [34]. It is well known that morbidity and mortality in older patients with T2DM could be reduced by preventing the progression to CKD [456]. However, it is not easy to prevent the progression to CKD in such patients because they are exposed to polypharmacy to control their comorbidities. The problems of polypharmacy are overdosing caused by drug-drug interaction or reduced clearance of drugs. In this study, so many older patients with T2DM had CKD; we should pay attention to their renal function. It is very important for physicians not only to monitor the renal function regularly and adjust the dose of drugs but also to prevent worsening of renal function when they manage older diabetic patients with CKD, especially in those who had diabetes longer than 10 years.
- Our study has some limitations. First, the study sample was not large and representative of the Korean population. Therefore, the results should be interpreted with caution. Second, the MDRD equation has not been validated in patients >70 years old, and no coefficient of the MDRD equation has yet been published for Koreans. This limitation might render CKD prevalence results imprecise. Third, we did not compare older patients with younger patients because we could not find a matched young-patient group. Nevertheless, this study might be valuable in presenting the finding that CKD was commonly observed in older patients with T2DM and that the progression rate to CKD was also high compared to the general population. Fourth, because this study included only the Korean population, the results cannot be applied directly to other ethnic populations. Finally, we could not analyze and reflect HbA1c variability and medication change during the follow-up period due to missing data. Large-scale prospective study would be warranted. However, this study might be meaningful because it evaluated renal function in older patients with T2DM and monitored them for up to 6 years.
- Because CKD was commonly observed in older patients with T2DM, and progression rate to CKD was also high, it is important to identify and manage CKD as early as possible in older patients with T2DM, especially in those whose diabetes duration was longer than 10 years.
DISCUSSION
-
Acknowledgements
- We thank all the study participants for their contribution to this study.
ACKNOWLEDGMENTS
-
CONFLICTS OF INTEREST: No potential conflict of interest relevant to this article was reported.
NOTES
- 1. Meguid El Nahas A, Bello AK. Chronic kidney disease: the global challenge. Lancet 2005;365:331-340. ArticlePubMed
- 2. Levey AS, Atkins R, Coresh J, Cohen EP, Collins AJ, Eckardt KU, Nahas ME, Jaber BL, Jadoul M, Levin A, Powe NR, Rossert J, Wheeler DC, Lameire N, Eknoyan G. Chronic kidney disease as a global public health problem: approaches and initiatives: a position statement from Kidney Disease Improving Global Outcomes. Kidney Int 2007;72:247-259. ArticlePubMed
- 3. Zhou XJ, Rakheja D, Yu X, Saxena R, Vaziri ND, Silva FG. The aging kidney. Kidney Int 2008;74:710-720. ArticlePubMed
- 4. de Boer IH, Rue TC, Hall YN, Heagerty PJ, Weiss NS, Himmelfarb J. Temporal trends in the prevalence of diabetic kidney disease in the United States. JAMA 2011;305:2532-2539. ArticlePubMedPMC
- 5. Afkarian M, Sachs MC, Kestenbaum B, Hirsch IB, Tuttle KR, Himmelfarb J, de Boer IH. Kidney disease and increased mortality risk in type 2 diabetes. J Am Soc Nephrol 2013;24:302-308. ArticlePubMedPMC
- 6. Go AS, Chertow GM, Fan D, McCulloch CE, Hsu CY. Chronic kidney disease and the risks of death, cardiovascular events, and hospitalization. N Engl J Med 2004;351:1296-1305. ArticlePubMed
- 7. Shlipak MG, Sarnak MJ, Katz R, Fried LF, Seliger SL, Newman AB, Siscovick DS, Stehman-Breen C. Cystatin C and the risk of death and cardiovascular events among elderly persons. N Engl J Med 2005;352:2049-2060. ArticlePubMed
- 8. Sarnak MJ, Levey AS, Schoolwerth AC, Coresh J, Culleton B, Hamm LL, McCullough PA, Kasiske BL, Kelepouris E, Klag MJ, Parfrey P, Pfeffer M, Raij L, Spinosa DJ, Wilson PW. American Heart Association Councils on Kidney in Cardiovascular Disease, High Blood Pressure Research, Clinical Cardiology, and Epidemiology and Prevention. Kidney disease as a risk factor for development of cardiovascular disease: a statement from the American Heart Association Councils on Kidney in Cardiovascular Disease, High Blood Pressure Research, Clinical Cardiology, and Epidemiology and Prevention. Circulation 2003;108:2154-2169. ArticlePubMed
- 9. O'Hare AM, Choi AI, Bertenthal D, Bacchetti P, Garg AX, Kaufman JS, Walter LC, Mehta KM, Steinman MA, Allon M, McClellan WM, Landefeld CS. Age affects outcomes in chronic kidney disease. J Am Soc Nephrol 2007;18:2758-2765. ArticlePubMed
- 10. Iglesias P, Heras M, Diez JJ. Diabetes mellitus and kidney disease in the elderly. Nefrologia 2014;34:285-292. PubMed
- 11. Lee SW, Kim YC, Oh SW, Koo HS, Na KY, Chae DW, Kim S, Chin HJ. Trends in the prevalence of chronic kidney disease, other chronic diseases and health-related behaviors in an adult Korean population: data from the Korean National Health and Nutrition Examination Survey (KNHANES). Nephrol Dial Transplant 2011;26:3975-3980. ArticlePubMed
- 12. Wasen E, Isoaho R, Mattila K, Vahlberg T, Kivela SL, Irjala K. Renal impairment associated with diabetes in the elderly. Diabetes Care 2004;27:2648-2653. ArticlePubMedPDF
- 13. Sheen YJ, Sheu WH. Risks of rapid decline renal function in patients with type 2 diabetes. World J Diabetes 2014;5:835-846. ArticlePubMedPMC
- 14. Afkarian M, Zelnick LR, Hall YN, Heagerty PJ, Tuttle K, Weiss NS, de Boer IH. Clinical manifestations of kidney disease among US adults with diabetes, 1988–2014. JAMA 2016;316:602-610. ArticlePubMedPMC
- 15. Lou Arnal LM, Campos Gutierrez B, Cuberes Izquierdo M, Gracia Garcia O, Turon Alcaine JM, Bielsa Garcia S, Gimeno Orna JA, Boned Juliani B, Sanjuan Hernandez-French A. Grupo de Investigacion ERC Aragon. Prevalence of chronic kidney disease in patients with type 2 diabetes mellitus treated in primary care. Nefrologia 2010;30:552-556. PubMed
- 16. Coresh J, Astor BC, Greene T, Eknoyan G, Levey AS. Prevalence of chronic kidney disease and decreased kidney function in the adult US population: third National Health and Nutrition Examination Survey. Am J Kidney Dis 2003;41:1-12. ArticlePubMed
- 17. Fox CS, Larson MG, Leip EP, Culleton B, Wilson PW, Levy D. Predictors of new-onset kidney disease in a community-based population. JAMA 2004;291:844-850. ArticlePubMed
- 18. Kim S, Lim CS, Han DC, Kim GS, Chin HJ, Kim SJ, Cho WY, Kim YH, Kim YS. The prevalence of chronic kidney disease (CKD) and the associated factors to CKD in urban Korea: a population-based cross-sectional epidemiologic study. J Korean Med Sci 2009;24(Suppl):S11-S21. ArticlePubMedPMC
- 19. Yun KJ, Kim HJ, Kim MK, Kwon HS, Baek KH, Roh YJ, Song KH. Risk factors for the development and progression of diabetic kidney disease in patients with type 2 diabetes mellitus and advanced diabetic retinopathy. Diabetes Metab J 2016;40:473-481. ArticlePubMedPMCPDF
- 20. Levey AS, Inker LA, Coresh J. Chronic kidney disease in older people. JAMA 2015;314:557-558. ArticlePubMed
- 21. Kirkman MS, Briscoe VJ, Clark N, Florez H, Haas LB, Halter JB, Huang ES, Korytkowski MT, Munshi MN, Odegard PS, Pratley RE, Swift CS. Diabetes in older adults. Diabetes Care 2012;35:2650-2664. ArticlePubMedPMCPDF
- 22. Sinclair A, Morley JE, Rodriguez-Manas L, Paolisso G, Bayer T, Zeyfang A, Bourdel-Marchasson I, Vischer U, Woo J, Chapman I, Dunning T, Meneilly G, Rodriguez-Saldana J, Gutierrez Robledo LM, Cukierman-Yaffe T, Gadsby R, Schernthaner G, Lorig K. Diabetes mellitus in older people: position statement on behalf of the International Association of Gerontology and Geriatrics (IAGG), the European Diabetes Working Party for Older People (EDWPOP), and the International Task Force of Experts in Diabetes. J Am Med Dir Assoc 2012;13:497-502. ArticlePubMed
- 23. National Kidney Foundation. K/DOQI clinical practice guidelines for chronic kidney disease: evaluation, classification, and stratification. Am J Kidney Dis 2002;39(2 Suppl 1):S1-S266. PubMed
- 24. Hwang SJ, Lin MY, Chen HC, Hwang SC, Yang WC, Hsu CC, Chiu HC, Mau LW. Increased risk of mortality in the elderly population with late-stage chronic kidney disease: a cohort study in Taiwan. Nephrol Dial Transplant 2008;23:3192-3198. ArticlePubMed
- 25. Korean Diabetes Association. Diabetes fact sheet in Korea 2016 cited 2018 Apr 11. Available from: http://www.diabetes.or.kr/temp/KDA_fact_sheet%202016.pdf.
- 26. Lundstrom UH, Gasparini A, Bellocco R, Qureshi AR, Carrero JJ, Evans M. Low renal replacement therapy incidence among slowly progressing elderly chronic kidney disease patients referred to nephrology care: an observational study. BMC Nephrol 2017;18:59. ArticlePubMedPMCPDF
- 27. Anderson S, Halter JB, Hazzard WR, Himmelfarb J, Horne FM, Kaysen GA, Kusek JW, Nayfield SG, Schmader K, Tian Y, Ashworth JR, Clayton CP, Parker RP, Tarver ED, Woolard NF, High KP. workshop participants. Prediction, progression, and outcomes of chronic kidney disease in older adults. J Am Soc Nephrol 2009;20:1199-1209. ArticlePubMed
- 28. Arora P, Jalal K, Gupta A, Carter RL, Lohr JW. Progression of kidney disease in elderly stage 3 and 4 chronic kidney disease patients. Int Urol Nephrol 2017;49:1033-1040. ArticlePubMedPDF
- 29. Hemmelgarn BR, Zhang J, Manns BJ, Tonelli M, Larsen E, Ghali WA, Southern DA, McLaughlin K, Mortis G, Culleton BF. Progression of kidney dysfunction in the community-dwelling elderly. Kidney Int 2006;69:2155-2161. ArticlePubMed
- 30. Costacou T, Orchard TJ. Cumulative kidney complication risk by 50 years of type 1 diabetes: the effects of sex, age, and calendar year at onset. Diabetes Care 2018;41:426-433. ArticlePubMedPDF
- 31. UK Prospective Diabetes Study (UKPDS) Group. Intensive blood-glucose control with sulphonylureas or insulin compared with conventional treatment and risk of complications in patients with type 2 diabetes (UKPDS 33). Lancet 1998;352:837-853. ArticlePubMed
- 32. Baid-Agrawal S, Reinke P, Schindler R, Tullius S, Frei U. WCN 2003 satellite symposium on kidney transplantation in the elderly, Weimar, Germany, June 12-14, 2003. Nephrol Dial Transplant 2004;19:43-46. ArticlePubMed
- 33. Gajjala PR, Sanati M, Jankowski J. Cellular and molecular mechanisms of chronic kidney disease with diabetes mellitus and cardiovascular diseases as its comorbidities. Front Immunol 2015;6:340. ArticlePubMedPMC
- 34. Kim KS, Kim SK, Sung KM, Cho YW, Park SW. Management of type 2 diabetes mellitus in older adults. Diabetes Metab J 2012;36:336-344. ArticlePubMedPMC
REFERENCES
Comparison of estimated glomerular filtration rate (eGFR) from baseline to the end of follow-up. aP<0.05.


Baseline characteristics of the study population according to the presence of chronic kidney disease at baseline
Values are presented as number (%) or mean±standard deviation.
CKD, chronic kidney disease; BMI, body mass index; HbA1c, glycosylated hemoglobin; eGFR, estimated glomerular filtration rate; ACR, albumin-to-creatinine ratio; HDL-C, high density lipoprotein cholesterol; ACEI, angiotensin-converting enzyme inhibitor; ARB, angiotensin II receptor blocker.
aHbA1c information was missing for 3 participants, bACR information was missing for 23 participants, cThe statistical significance test was done by Mann-Whitney U test.
Odds ratios for the predictors of chronic kidney disease at baseline
Transitions for stage of chronic kidney disease from baseline to the end of follow-up in older patients with type 2 diabetes mellitus
| Stage of CKD | To | Total | |||
|---|---|---|---|---|---|
| 1 | 2 | 3 | 4 or more | ||
| From | |||||
| 1 | 1 | 5 | 1 | 1 | 8 |
| 2 | 4 | 54 | 38 | 2 | 98 |
| 3 | 0 | 9 | 62 | 13 | 84 |
| 4 or more | 0 | 0 | 0 | 0 | 0 |
| Total | 5 | 68 | 101 | 16 | 190 |
Transitions for albuminuria categories from baseline to the end of follow-up in older patients with type 2 diabetes mellitus
| Albuminuria categories | To | Total | ||
|---|---|---|---|---|
| Normoalbuminuria | Microalbuminuria | Macroalbuminuria | ||
| From | ||||
| Normoalbuminuria | 67 | 26 | 3 | 96 |
| Microalbuminuria | 3 | 45 | 4 | 52 |
| Macroalbuminuria | 1 | 1 | 17 | 19 |
| Total | 71 | 72 | 24 | 167 |
Figure & Data
References
Citations
- Assessing heatwave effects on disabled persons in South Korea
Yeji Kang, Ingul Baek, Jongchul Park
Scientific Reports.2024;[Epub] CrossRef - Combination of Risks of BMI and Health-Related Lifestyles on Kidney Function in the Prediabetic Japanese Population: A Prospective Cohort Study
Jou-Yin Chen, Shiqi Deng, Yukiko Wagatsuma
International Journal of Environmental Research and Public Health.2023; 20(7): 5338. CrossRef - Hormonal imbalance in patients with chronic renal failure in the pre-dialysis and dialysis periods (part1)
I.P. Katerenchuk, S.T. Rustamyan, V.V. Talash, T.I. Yarmola
INTERNATIONAL JOURNAL OF ENDOCRINOLOGY (Ukraine).2023; 19(1): 65. CrossRef - The Beneficial Effect of Glycemic Control against Adverse Outcomes in Patients with Type 2 Diabetes Mellitus and Chronic Kidney Disease
Dong-Hwa Lee
Diabetes & Metabolism Journal.2023; 47(4): 484. CrossRef - Association Between Continuous Glucose Monitoring-Derived Glycemia Risk Index and Albuminuria in Type 2 Diabetes
Jee Hee Yoo, Ji Yoon Kim, Jae Hyeon Kim
Diabetes Technology & Therapeutics.2023; 25(10): 726. CrossRef - Global burden and influencing factors of chronic kidney disease due to type 2 diabetes in adults aged 20–59 years, 1990–2019
Dandan Xie, Tianpeng Ma, Haoliang Cui, Jing Li, Aihua Zhang, Zhifeng Sheng, Yiqiang Xie
Scientific Reports.2023;[Epub] CrossRef - Effectiveness of Early Advanced Glycation End Product Accumulation Testing in the Diagnosis of Diabetes: A Health Risk Factor Analysis Using the Body Mass Index as a Moderator
Yi Zhang, Tian Jiang, Chao Liu, Honglin Hu, Fang Dai, Li Xia, Qiu Zhang
Frontiers in Endocrinology.2022;[Epub] CrossRef - Causal association pathways between fetuin-A and kidney function: a mediation analysis
Philip Etabee Bassey, Pawin Numthavaj, Sasivimol Rattanasiri, Piyamitr Sritara, Mark McEvoy, Boonsong Ongphiphadhanakul, Ammarin Thakkinstian
Journal of International Medical Research.2022; 50(4): 030006052210828. CrossRef - Advanced glycation end products and diabetes and other metabolic indicators
Tian Jiang, Yi Zhang, Fang Dai, Chao Liu, Honglin Hu, Qiu Zhang
Diabetology & Metabolic Syndrome.2022;[Epub] CrossRef - Type 2 diabetes management in people aged over seventy-five years: targets and treatment strategies
Theocharis Koufakis, Maria Grammatiki, Kalliopi Kotsa
Maturitas.2021; 143: 118. CrossRef - Comparative Efficacy of Lobeglitazone Versus Pioglitazone on Albuminuria in Patients with Type 2 Diabetes Mellitus
Kyung-Soo Kim, Sangmo Hong, Hong-Yup Ahn, Cheol-Young Park
Diabetes Therapy.2021; 12(1): 171. CrossRef - Chronic kidney disease progression in aged patients
Murat Tuğcu, Dilek Barutçu Ataş
International Urology and Nephrology.2021; 53(12): 2619. CrossRef - Factors determining the clinical significance of dipeptidyl peptidase-4 inhibitors in the treatment of elderly patients with type 2 diabetes mellitus
I. V. Glinkina, A. V. Balashova, A. S. Shyman, A. V. Oderij, S. A. Khan, G. E. Runova, T. B. Morgunova, V. V. Fadeev
Meditsinskiy sovet = Medical Council.2021; (7): 56. CrossRef - Effect of Oral carnosine supplementation on urinary TGF-β in diabetic nephropathy: a randomized controlled trial
Narongrit Siriwattanasit, Bancha Satirapoj, Ouppatham Supasyndh
BMC Nephrology.2021;[Epub] CrossRef - Estimation of the prevalence of type 2 diabetes in combination with diabetic kidney disease and identification of the associated factors in patients attending primary hospitals in Anhui Province, China
Li Xia, Lanlan Cheng, Tian Jiang, Chao Liu, Shiqi Zhang, Honglin Hu, Fang Dai, Qiu Zhang, Yunxia Lu
Journal of International Medical Research.2021; 49(10): 030006052110512. CrossRef - A STUDY TO EVALUATE THE EFFECT OF ANAEMIA IN TYPE-2 DIABETIC PATIENTS
Radhika Maheshwari, Divya J., J. Sahayaraj, Muthukrishnan R.
GLOBAL JOURNAL FOR RESEARCH ANALYSIS.2021; : 117. CrossRef - Metformin treatment for patients with diabetes and chronic kidney disease: A Korean Diabetes Association and Korean Society of Nephrology consensus statement
Kyu Yeon Hur, Mee Kyoung Kim, Seung Hyun Ko, Miyeun Han, Dong Won Lee, Hyuk-Sang Kwon
Kidney Research and Clinical Practice.2020; 39(1): 32. CrossRef - Metformin Treatment for Patients with Diabetes and Chronic Kidney Disease: A Korean Diabetes Association and Korean Society of Nephrology Consensus Statement
Kyu Yeon Hur, Mee Kyoung Kim, Seung Hyun Ko, Miyeun Han, Dong Won Lee, Hyuk-Sang Kwon
Diabetes & Metabolism Journal.2020; 44(1): 3. CrossRef - The prevalence of diabetic chronic kidney disease in adult Greek subjects with type 2 diabetes mellitus: A series from hospital-based diabetes clinics
Ilias N. Migdalis, Nikolaos Papanas, Athanasios E. Raptis, Ioannis M. Ioannidis, Alexios E. Sotiropoulos, George D. Dimitriadis
Diabetes Research and Clinical Practice.2020; 166: 108243. CrossRef - Proteinuria Is Associated with Carotid Artery Atherosclerosis in Non-Albuminuric Type 2 Diabetes: A Cross-Sectional Study
Jaehyun Bae, Yong-ho Lee, Eun Seok Kang, Bong-Soo Cha, Byung-Wan Lee
Journal of Clinical Medicine.2020; 9(1): 136. CrossRef - Renal status in elderly patients with type 2 diabetes
Kazunaga Takamatsu
Clinical and Experimental Nephrology.2020; 24(1): 53. CrossRef - The fat mass, estimated glomerular filtration rate, and chronic inflammation in type 2 diabetic patients
Tomáš Šálek, Alena Adamíková, Petr Ponížil
Journal of Clinical Laboratory Analysis.2020;[Epub] CrossRef - Insulin: Trigger and Target of Renal Functions
Ana F. Pina, Diego O. Borges, Maria João Meneses, Patrícia Branco, Rita Birne, Antonio Vilasi, Maria Paula Macedo
Frontiers in Cell and Developmental Biology.2020;[Epub] CrossRef - Rate of kidney function decline and factors predicting progression of kidney disease in type 2 diabetes mellitus patients with reduced kidney function: A nationwide retrospective cohort study
Wisit Kaewput, Charat Thongprayoon, Api Chewcharat, Ram Rangsin, Bancha Satirapoj, Chalermrat Kaewput, Picha Suwannahitatorn, Tarun Bathini, Michael A. Mao, Liam D. Cato, Andrew M. Harrison, Pradeep Vaitla, Wisit Cheungpasitporn
Therapeutic Apheresis and Dialysis.2020; 24(6): 677. CrossRef - Association Between Continuous Glucose Monitoring-Derived Time in Range, Other Core Metrics, and Albuminuria in Type 2 Diabetes
Jee Hee Yoo, Min Sun Choi, Jiyeon Ahn, Sung Woon Park, Yejin Kim, Kyu Yeon Hur, Sang-Man Jin, Gyuri Kim, Jae Hyeon Kim
Diabetes Technology & Therapeutics.2020; 22(10): 768. CrossRef - Comparison of Renal Effects of Ezetimibe–Statin Combination versus Statin Monotherapy: A Propensity-Score-Matched Analysis
Jaehyun Bae, Namki Hong, Byung-Wan Lee, Eun Seok Kang, Bong-Soo Cha, Yong-ho Lee
Journal of Clinical Medicine.2020; 9(3): 798. CrossRef - Metformin Use and Risk of All-Cause Mortality and Cardiovascular Events in Patients With Chronic Kidney Disease—A Systematic Review and Meta-Analysis
Yao Hu, Min Lei, Guibao Ke, Xin Huang, Xuan Peng, Lihui Zhong, Ping Fu
Frontiers in Endocrinology.2020;[Epub] CrossRef - Treatment with Cinacalcet in Hemodialysis Patients with Severe Secondary Hyperparathyroidism, Influences Bone Mineral Metabolism and Anemia Parameters
Maria Aktsiali, Theodora Papachrysanthou , Ioannis Griveas, Christos Andriopoulos, Panagiotis Sitaras, Ioannis K. Triantafyllopoulos , George I. Lambrou
Current Drug Therapy.2020; 15(3): 249. CrossRef - Gemigliptin Attenuates Renal Fibrosis Through Down-Regulation of the NLRP3 Inflammasome
Jung Beom Seo, Yeon-Kyung Choi, Hye-In Woo, Yun-A Jung, Sungwoo Lee, Seunghyeong Lee, Mihyang Park, In-Kyu Lee, Gwon-Soo Jung, Keun-Gyu Park
Diabetes & Metabolism Journal.2019; 43(6): 830. CrossRef - Glucometabolic characteristics and higher vascular complication risk in Korean patients with type 2 diabetes with non-albumin proteinuria
Yongin Cho, Yong-ho Lee, Eun Seok Kang, Bong-soo Cha, Byung-wan Lee
Journal of Diabetes and its Complications.2019; 33(8): 585. CrossRef - Assessment of kidney function and associated risk factors among type 2 diabetic patients
Moyad Jamal Shahwan, Nageeb Abdul galil Hassan, Rima Ahd Shaheen
Diabetes & Metabolic Syndrome: Clinical Research & Reviews.2019; 13(4): 2661. CrossRef - Influence of diabetes mellitus on patients with lumbar spinal stenosis: A nationwide population-based study
Chang Kyu Lee, Sun Kyu Choi, Dong Ah Shin, Seong Yi, Yoon Ha, Keung Nyun Kim, Insoo Kim, Gregory W.J. Hawryluk
PLOS ONE.2019; 14(3): e0213858. CrossRef - Predictores de progresión de enfermedad renal en el paciente anciano
Manuel Heras Benito, Mª José Fernández Reyes Luis
Enfermería Nefrológica.2019; 22(1): 19. CrossRef
 PubReader
 Cite
Cite- Figure
-

- Related articles
-
- Risk Prediction and Management of Chronic Kidney Disease in People Living with Type 2 Diabetes Mellitus
- Clinical and Lifestyle Determinants of Continuous Glucose Monitoring Metrics in Insulin-Treated Patients with Type 2 Diabetes Mellitus
- The Beneficial Effect of Glycemic Control against Adverse Outcomes in Patients with Type 2 Diabetes Mellitus and Chronic Kidney Disease
- The Role of Echocardiography in Evaluating Cardiovascular Diseases in Patients with Diabetes Mellitus
- Glycemic Control and Adverse Clinical Outcomes in Patients with Chronic Kidney Disease and Type 2 Diabetes Mellitus: Results from KNOW-CKD


