- Current
- Browse
- Collections
-
For contributors
- For Authors
- Instructions to authors
- Article processing charge
- e-submission
- For Reviewers
- Instructions for reviewers
- How to become a reviewer
- Best reviewers
- For Readers
- Readership
- Subscription
- Permission guidelines
- About
- Editorial policy
Articles
- Page Path
- HOME > Diabetes Metab J > Volume 40(4); 2016 > Article
-
Original ArticleOthers Evaluation of a Novel Glucose Area Under the Curve (AUC) Monitoring System: Comparison with the AUC by Continuous Glucose Monitoring
-
Satoshi Ugi1
 , Hiroshi Maegawa1, Katsutaro Morino1, Yoshihiko Nishio2, Toshiyuki Sato3, Seiki Okada3, Yasuo Kikkawa3, Toshihiro Watanabe3, Hiromu Nakajima4, Atsunori Kashiwagi5
 -
Diabetes & Metabolism Journal 2016;40(4):326-333.
DOI: https://doi.org/10.4093/dmj.2016.40.4.326
Published online: July 26, 2016
1Department of Medicine, Shiga University of Medical Science, Otsu, Japan.
2Department of Diabetes and Endocrine Medicine, Kagoshima University Graduate School of Medical and Dental Science, Kagoshima, Japan.
3Central Research Laboratories, Sysmex Corporation, Kobe, Japan.
4Department of Clinical Laboratory, Osaka Medical Center for Cancer and Cardiovascular Diseases, Osaka, Japan.
5Department of Medicine, Kusatsu General Hospital, Kusatsu, Japan.
- Corresponding author: Satoshi Ugi. Department of Medicine, Shiga University of Medical Science, Setatsukinowacho, Otsu, Shiga 520-2192, Japan. sugi@belle.shiga-med.ac.jp
Copyright © 2016 Korean Diabetes Association
This is an Open Access article distributed under the terms of the Creative Commons Attribution Non-Commercial License (http://creativecommons.org/licenses/by-nc/4.0/) which permits unrestricted non-commercial use, distribution, and reproduction in any medium, provided the original work is properly cited.
ABSTRACT
-
Background
- Management of postprandial hyperglycemia is a key aspect in diabetes treatment. We developed a novel system to measure glucose area under the curve (AUC) using minimally invasive interstitial fluid extraction technology (MIET) for simple monitoring of postprandial glucose excursions. In this study, we evaluated the relationship between our system and continuous glucose monitoring (CGM) by comparing glucose AUC obtained using MIET with that obtained using CGM for a long duration.
-
Methods
- Twenty diabetic inpatients wearing a CGM system were enrolled. For MIET measurement, a plastic microneedle array was applied to the skin as pretreatment, and hydrogels were placed on the pretreated area to collect interstitial fluid. Hydrogels were replaced every 2 or 4 hours and AUC was predicted on the basis of glucose and sodium ion levels.
-
Results
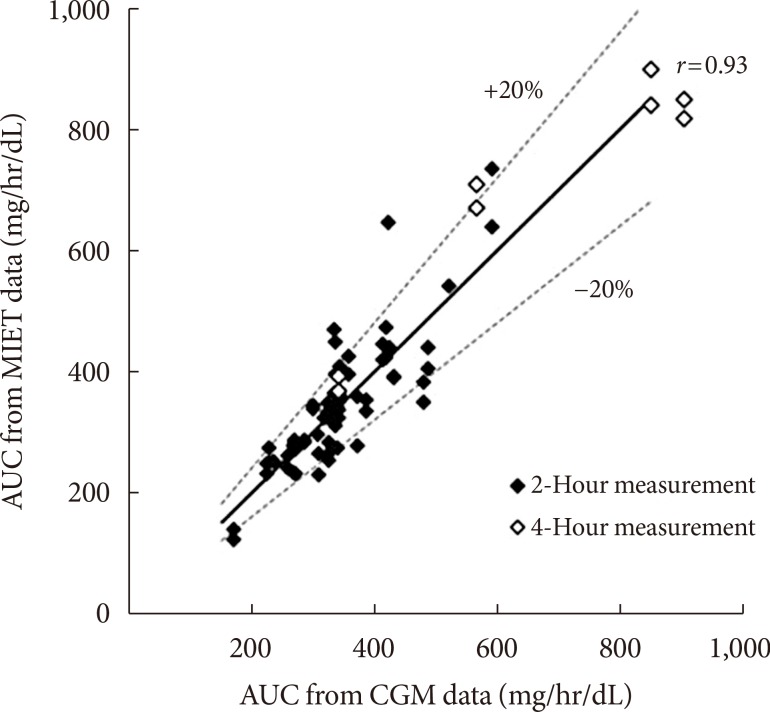
- AUC predicted by MIET correlated well with that measured by CGM (r=0.93). Good performances of both consecutive 2- and 4-hour measurements were observed (measurement error: 11.7%±10.2% for 2 hours and 11.1%±7.9% for 4 hours), indicating the possibility of repetitive measurements up to 8 hours. The influence of neither glucose fluctuation nor average glucose level over the measurement accuracy was observed through 8 hours.
-
Conclusion
- Our system showed good relationship with AUC values from CGM up to 8 hours, indicating that single pretreatment can cover a large portion of glucose excursion in a day. These results indicated possibility of our system to contribute to convenient monitoring of glucose excursions for a long duration.
- The management of blood glucose levels is indispensable in delaying or preventing the onset of complications in the patients with diabetes mellitus. In general, patients with impaired glucose tolerance or postprandial hyperglycemia are recognized to have a higher risk of developing diabetes than those with normal glucose tolerance [1]. There are some clinical evidences that treating postprandial hyperglycemia [2] could delay the onset of diabetes or prevent complications [3]. Therefore, from the early stage of glucose intolerance, the management of patients focusing to postprandial hyperglycemia could be beneficial for the long-term outcome of glycemic control.
- Glycosylated hemoglobin (HbA1c) is a widely approved and used index for glycemic control, reflecting the average blood glucose levels over the last 2 to 3 months. Although it is an important index of treatment compliance and response [45], it may not be sufficient for specific monitoring of postprandial fluctuating glycemic excursions.
- Recently, continuous glucose monitoring (CGM) has made it possible to observe blood glucose profiles, providing a new option for monitoring and treating diabetes. However, CGM requires blood sampling for calibration and can be applied to a limited number of patients because it costs time and money. Thus, a convenient method capable of specific monitoring of postprandial hyperglycemia could overcome the shortcomings of existing indices and systems.
- We have developed a novel system to measure glucose area under the curve (AUC) using minimally invasive interstitial fluid extraction technology (MIET) [67]. This easy-to-use system requires no blood sampling and is expected to provide simple and convenient monitoring for glycemic excursion. Previously, we reported that this system can measure glucose AUC regardless of glucose tolerance [8] and that AUC measured by this system is useful for screening patients with glucose intolerance [9]. Further, the reported good performance of a system based on interstitial fluid (ISF) collection by passive diffusion, symphony CGM [10], indicates that the concept of our monitoring system that extracting ISF by passive diffusion for a defined period and estimating glucose AUC from accumulated glucose level is reasonable. Moreover, our system showed possibility to provide glycemic indices for some confectionery [11], which are supposed to closely represent the daily situation. However, in daily life, patients may need to monitor blood glucose increases not only after a single meal but also after every meal. Therefore, it would be beneficial to know the blood glucose status for the longer periods of time in a day and the more frequent measurements in several meals for the accurate evaluation of clinical glycemic control.
- In the present study, we evaluated the relationship of AUC measurement up to 8 hours in this system in reference to CGM. Moreover, the accuracy of AUC measurement between consecutive 2-hour measurement, consecutive 4-hour measurement, and repetitive 2-hour measurement were compared.
INTRODUCTION
- Subjects
- Twenty inpatients with diabetes undergoing CGM (CGMS-Gold; Medtronic, Minneapolis, MN, USA) for the purpose of treatment response monitoring were enrolled. The baseline clinical characteristics of the patients are shown in Table 1. The study was conducted following the latest version of the Declaration of Helsinki and the study protocol was approved by the Ethics Committee of Shiga University of Medical Science (Shiga, Japan), and all participants provided written informed consent for study participation.
- Clinical evaluation protocol
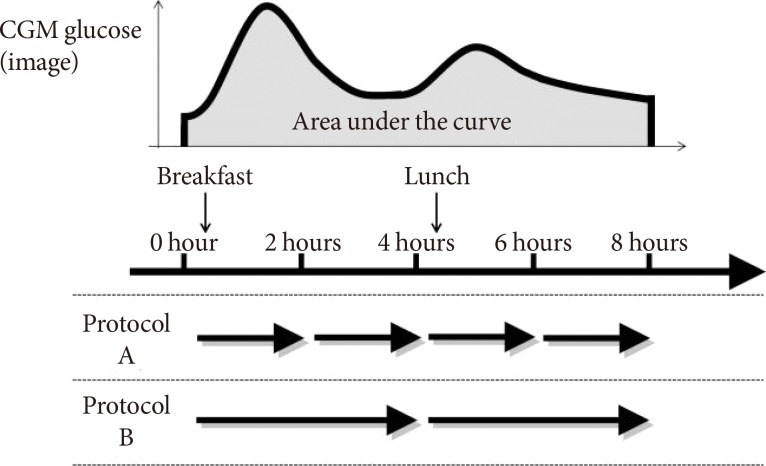
- Fifteen patients were recruited to protocol A, and the other five patients were recruited to protocol B (Fig. 1).
- For MIET measurement, ISF was collected from the skin of the forearm. The collection site was wiped with an antiseptic, and microneedle arrays were then stamped at two sites using a microneedle applicator. Two hydrogel patches were placed on each pretreated area to absorb ISF, and a third hydrogel patch was placed on an untreated area for sweat monitoring. After 2 (protocol A) or 4 (protocol B) hours, all patches were replaced with new ones. After 4 (protocol A) or 2 (protocol B) cycles, all patches were collected to analyze ISF composition. As previously reported [6], MIET uses Na+ collected simultaneously with glucose in hydrogels as an internal standard. Since Na+ levels in ISF are supposed to be constant inter- and intraindividual, calibration can be completed without blood glucose levels.
- Immediately after ISF extraction, patients were requested to complete a questionnaire and provide feedback on the system.
- Apparatus and materials
- Details of the apparatus have been described in our earlier reports [912]. In summary, polycarbonate microneedle arrays and an applicator for stamping were used for pretreatment and a hydrogel patch comprising a polyvinyl alcohol hydrogel and an adhesive tape were used for ISF collection. The reagent for glucose analysis was composed of glucose oxidase (GOD), mutarotase, peroxidase, ascorbic acid oxidase, and fluorescent dye (Amplex Red; ThermoFisher, Yokohama, Japan).
- Procedures for glucose and sodium ion analyses
- A detailed description of our procedures has been provided in our earlier reports [69]. Briefly, the hydrogel was separated from the adhesive tape and immersed into pure water to extract glucose and sodium. The glucose level was measured using the GOD method, and sodium ion level was measured using ion chromatography.
- Data analysis methods
- Reference CGM-AUCs were calculated by trapezoidal approximation of glucose levels that were measured every 5 minutes. The CGM value at x minutes was termed as glucose (x), and the reference CGM-AUC for 2 hours was calculated as follows:
- The reference CGM-AUC for 4 hours can be calculated similarly.
- Details and principles of data analysis for calculating MIET-AUC have been previously described [6].
METHODS
- Performance of AUC measurement by MIET
- Originally, 20 patients were enrolled and expected total samples were 120 samples. However, two patients were excluded from the performance analysis because of mechanical problems with CGMS-Gold. Another patient interrupted CGM during the evaluation, and only the data recorded before the interruption were used for analysis. Total samples excluding these problems were 108. Moreover, samples with errors of MIET (sodium ion extraction rate at intact area >0.04 nmol/hr as influence of sweat contamination (12 samples, 11.1%) or glucose permeability <2 cm/hr as too small extracted volume for correct measurement (18 samples, 16.7%) or samples with large dissociation of blood glucose levels between self-monitoring blood glucose for calibration and CGM (approximately 70 mg/dL) were excluded from analysis (2 samples, 1.9%). Finally, 76 samples were used for analysis.
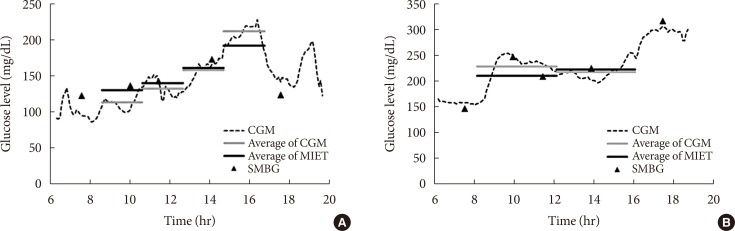
- Fig. 2 shows typical data of the blood glucose profile and our AUC measurement. Fig. 3 shows the correlation between AUC estimated by MIET (MIET-AUC) and that calculated from CGM profiles (CGM-AUC). MIET-AUC correlated well with CGM-AUC, regardless of the extraction time of ISF (r=0.93). This correlation corresponded with the previous result when CGM-AUC was substituted with plasma glucose AUC [9].
- Comparison of extraction time between 2 and 4 hours
- The discrepancy between MIET-AUC and CGM-AUC among extraction conditions was examined. Consecutive 2-hour extraction showed 11.7%±10.2% of variance and consecutive 4-hour extraction showed 11.1%±7.9% of variance (not significant) between MIET-AUC and CGM-AUC. Previous data [8] showed 9.4%±6.8% of variance between MIET-AUC and plasma glucose AUC for the 2-hour extraction after oral glucose tolerance test. These data suggest nearly equivalent performance of the 2- and 4-hour extraction.
- Performance of MIET in repetitive measurements
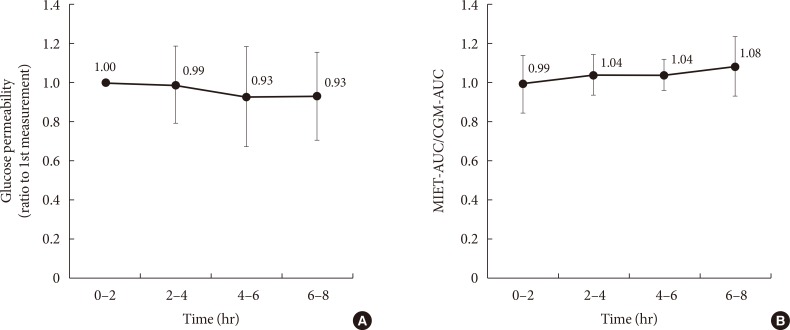
- In our system, micropores formed before ISF extraction may contract over time, and this could affect the performance in repetitive measurements. In this regard, Fig. 4A shows the time-dependent change of glucose permeability in the collected ISF. The ISF was collected constantly up to 8 hours, and no significant time-dependent change was observed with regard to MIET performance (Fig. 4B). No statistically significant differences were observed between each period; thus, the accuracy of repetitive extraction up to 8 hours was confirmed.
- Possible factors affecting the performance of MIET
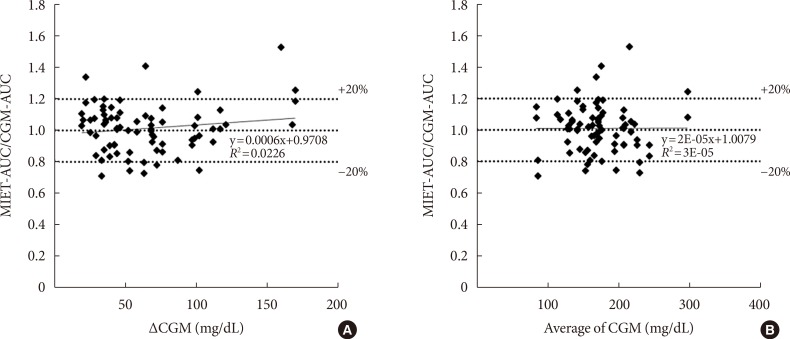
- Fig. 5 shows the influence of glucose profiles on MIET performance. One concern was that the wide fluctuation of glucose levels might degrade the performance of our system because of the time lag with ISF extraction. Moreover, the suitability of our system to wide range of glucose levels from diabetes patients was examined. Neither glucose fluctuation (Fig. 5A) nor average glucose level (Fig. 5B) affected glucose AUC measured by MIET. These results indicate that the performance of our system was minimally influenced by patient glucose profiles.
- Questionnaire for patients
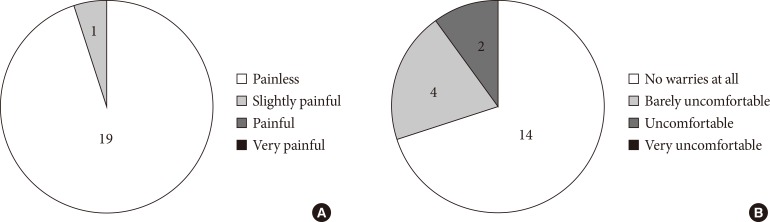
- Fig. 6 shows the results of a questionnaire for patients, confirming the painless nature of MIET. However, two patients felt uncomfortable when hydrogel patches were attached. This discomfort was described as itching in one case and a vague discomfort in the other.
RESULTS
- The results of the present study suggest that our system can be applicable to the measurement of glucose AUC up to 8 hours in the comparable accuracy and less invasiveness to the conventional methodologies.
- Adequacy of the length of measurement period
- The peak time of plasma glucose is known to vary depending on various factors, such as meal content, eating speed, and glucose tolerance. However, in most cases, peak time exists between 30 minutes and 3 hours after meals. Therefore, 4-hour consecutive samples are supposed to cover the full amplitude of glucose fluctuation after meals, and the results of this study indicate that the MIET system can represent postprandial glucose AUC in a wide variety of situations.
- Differences between CGM and MIET
- Both CGM and MIET measure glucose levels of the ISF; however, there are some technical differences between these two systems in glucose sensing. As widely known, sensors for CGM are subcutaneously inserted and directly measure glucose levels of ISF. In contrast, MIET extracts ISF to the body surface. Because the microneedles used for MIET pierce to a depth of approximately 100 µm, the ISF near skin surface could be easily extracted. Therefore, CGM and MIET might reflect glucose levels of ISF from different depths, which can provide different glucose levels between the two systems.
- In addition, sensors for CGM are usually inserted over the abdomen, whereas MIET extracts ISF from the forearm. Considering that changes related to a site difference for blood glucose have been reported [13], this difference may result in different measurements between the two systems.
- Regarding the first point, in most cases that MIET-AUC was rather far below CGM-AUC, glycemic profiles by CGM showed relatively rapid elevation while opposite cases had a tendency of rapid decrease. As mentioned above, CGM is supposed to measure deeper ISF from skin and closer to blood vessel compared with MIET, which may contribute to some extent. However, this tendency was not true in all cases; therefore, other differences such as the second point or calibration method, seemed to contribute to the results. We need more detailed and rigorous study to clarify the relationship between the accuracy of our system and the change rate of blood glucose levels, which is a subject for future study.
- Application of the MIET system
- This study indicated that the MIET system could reflect post-prandial glucose profiles up to 8 hours. Existing indices, such as HbA1c values, reflect average blood glucose levels for 1 to 2 months before blood sampling. In contrast, in our system, merely an adjustment of the application time of gel patch would provide AUC for a designated period. In this study, our system could reflect postprandial states following two meals, and this valuable period for clinical practice should be examined in future studies.
- Glucose profiles provided by CGM are useful for diabetes management; however, CGM is applicable to a limited number of patients because it costs time and money. Blood sampling for calibration places stress on patients, and some patients feel uncomfortable about the use of an indwelling sensor. Utilizing the complete information provided by CGM in daily self-management can be difficult for patients without medical knowledge because it contains a lot of indices. In contrast, MIET allows convenient monitoring of glucose excursion by providing a simple index, glucose AUC, without blood sampling. Therefore, MIET can be applicable to patients from relatively early-stage diabetes for daily management of blood glucose. On the other hand, there are some situations in which MIET might not be fully beneficial, such as detection of hypoglycemia. In these cases, CGM could be effective, and thus, MIET and CGM may be complementary each other.
- Study limitations
- As this study was a feasibility study, the sample size was limited. A larger sample size is required to validate the relationship between MIET and CGM in AUC measurement. In addition, CGM has some measurement error compared with plasma glucose levels and thorough evaluation of CGM accuracy is required in parallel. Moreover, although the possibility of measurement up to 8 hours using MIET was suggested, each period of AUC measurement was 2 or 4 hours. Therefore, the device should be tested in future studies for longer durations, such as consecutively for 8 hours.
- In conclusion, the results of the present study suggest that MIET can provide simple AUC measurements with comparable accuracy to CGM for up to 8 hours, indicating that a large part of the daytime glucose excursion can be covered by our system.
DISCUSSION
-
Acknowledgements
- Parts of this study were presented at the 47th European Association for the Study of Diabetes, the 54th General Conference of the Japan Diabetes Society etc.
ACKNOWLEDGMENTS
-
CONFLICTS OF INTEREST: This study was performed by the Minimally Invasive Interstitial Fluid Extraction Technology (MIET) study group, which was sponsored by Sysmex Corporation, Japan. S. Ugi, H. Maegawa, K. Morino, Y. Nishio, H. Nakajima, and A. Kashiwagi received research funding from Sysmex. H. Nakajima is a medical advisor for GlaxoSmithKline KK. T. Sato, S. Okada, Y. Kikkawa, and T. Watanabe are employees of Sysmex.
NOTES
- 1. Ramlo-Halsted BA, Edelman SV. The natural history of type 2 diabetes: practical points to consider in developing prevention and treatment strategies. Clin Diabetes 2000;18:80-84.
- 2. Hanefeld M, Chiasson JL, Koehler C, Henkel E, Schaper F, Temelkova-Kurktschiev T. Acarbose slows progression of intima-media thickness of the carotid arteries in subjects with impaired glucose tolerance. Stroke 2004;35:1073-1078. ArticlePubMed
- 3. Kawamori R, Tajima N, Iwamoto Y, Kashiwagi A, Shimamoto K, Kaku K. Voglibose Ph-3 Study Group. Voglibose for prevention of type 2 diabetes mellitus: a randomised, double-blind trial in Japanese individuals with impaired glucose tolerance. Lancet 2009;373:1607-1614. ArticlePubMed
- 4. The Diabetes Control and Complications Trial Research Group. The effect of intensive treatment of diabetes on the development and progression of long-term complications in insulin-dependent diabetes mellitus. N Engl J Med 1993;329:977-986. ArticlePubMed
- 5. Ohkubo Y, Kishikawa H, Araki E, Miyata T, Isami S, Motoyoshi S, Kojima Y, Furuyoshi N, Shichiri M. Intensive insulin therapy prevents the progression of diabetic microvascular complications in Japanese patients with non-insulin-dependent diabetes mellitus: a randomized prospective 6-year study. Diabetes Res Clin Pract 1995;28:103-117. ArticlePubMed
- 6. Sato T, Okada S, Hagino K, Asakura Y, Kikkawa Y, Kojima J, Watanabe T, Maekawa Y, Isobe K, Koike R, Nakajima H, Asano K. Measurement of glucose area under the curve using minimally invasive interstitial fluid extraction technology: evaluation of glucose monitoring concepts without blood sampling. Diabetes Technol Ther 2011;13:1194-1200. ArticlePubMed
- 7. Sakaguchi K, Hirota Y, Hashimoto N, Ogawa W, Hamaguchi T, Matsuo T, Miyagawa J, Namba M, Sato T, Okada S, Tomita K, Matsuhisa M, Kaneto H, Kosugi K, Maegawa H, Nakajima H, Kashiwagi A. Evaluation of a minimally invasive system for measuring glucose area under the curve during oral glucose tolerance tests: usefulness of sweat monitoring for precise measurement. J Diabetes Sci Technol 2013;7:678-688. ArticlePubMedPMCPDF
- 8. Sakaguchi K, Hirota Y, Hashimoto N, Ogawa W, Sato T, Okada S, Hagino K, Asakura Y, Kikkawa Y, Kojima J, Maekawa Y, Nakajima H. A minimally invasive system for glucose area under the curve measurement using interstitial fluid extraction technology: evaluation of the accuracy and usefulness with oral glucose tolerance tests in subjects with and without diabetes. Diabetes Technol Ther 2012;14:485-491. ArticlePubMed
- 9. Sakamoto K, Kubo F, Yoshiuchi K, Ono A, Sato T, Tomita K, Sakaguchi K, Matsuhisa M, Kaneto H, Maegawa H, Nakajima H, Kashiwagi A, Kosugi K. Usefulness of a novel system for measuring glucose area under the curve while screening for glucose intolerance in outpatients. J Diabetes Investig 2013;4:552-559.ArticlePubMedPMCPDF
- 10. Saur NM, England MR, Menzie W, Melanson AM, Trieu MQ, Berlin J, Hurley J, Krystyniak K, Kongable GL, Nasraway SA Jr. Accuracy of a novel noninvasive transdermal continuous glucose monitor in critically ill patients. J Diabetes Sci Technol 2014;8:945-950. ArticlePubMedPMCPDF
- 11. Kuranuki S, Sato T, Okada S, Hosoya S, Seko A, Sugihara K, Nakamura T. Evaluation of postprandial glucose excursion using a novel minimally invasive glucose area-under-the-curve monitoring system. J Healthc Eng 2013;4:529-540. ArticlePubMedPDF
- 12. Watanabe T, Hagino K, Sato T. Evaluation of the effect of polymeric microneedle arrays of varying geometries in combination with a high-velocity applicator on skin permeability and irritation. Biomed Microdevices 2014;16:591-597. ArticlePubMedPDF
- 13. Ellison JM, Stegmann JM, Colner SL, Michael RH, Sharma MK, Ervin KR, Horwitz DL. Rapid changes in postprandial blood glucose produce concentration differences at finger, forearm, and thigh sampling sites. Diabetes Care 2002;25:961-964. ArticlePubMedPDF
REFERENCES
Scheme of the evaluation protocol. In protocol A, 10 patients and five patients underwent repetitive measurement of minimally invasive interstitial fluid extraction technology three and four times, respectively. Five patients in protocol A and all patients in protocol B underwent application of hydrogel patches before the evaluation for the purpose of the cleaning of skin surface. These patches for cleaning were not included in the analysis. CGM, continuous glucose monitoring.
Typical data of minimally invasive interstitial fluid extraction technology (MIET; solid black line) compared with data of continuous glucose monitoring (CGM; dotted line as the glucose profile and solid gray line as area under the curve from the glucose profile). (A) For protocol A and (B) for protocol B. SMBG, self-monitoring of blood glucose.
Correlation between area under the curve estimated by minimally invasive interstitial fluid extraction technology (MIET-AUC) and that calculated from continuous glucose monitoring profiles (CGM-AUC). Solid line indicates y=x.
Comparison of performance for extraction conditions: (A) change in glucose permeability and (B) that of minimally invasive interstitial fluid extraction technology (MIET) performance compared with continuous glucose monitoring (CGM) in repetitive measurements. Results are shown as the mean±standard deviation. AUC, area under the curve.

The influence of (A) glucose fluctuation and (B) average glucose levels on minimally invasive interstitial fluid extraction technology (MIET) performance. ΔCGM indicates the difference between the peak and the nadir values of continuous glucose monitoring (CGM) in the measurement period. AUC, area under the curve.

The results of a questionnaire about (A) pain at stamping and (B) impression regarding the hydrogel patch. With regards to the impression regarding the hydrogel patch, one patient experienced localized itching and, the other, vague discomfort.
Subject characteristics at baseline
Figure & Data
References
Citations
- Continuous glucose monitoring metrics and pregnancy outcomes in insulin‐treated diabetes: A post‐hoc analysis of the GlucoMOMS trial
Doortje Rademaker, Anne W. T. van der Wel, Rik van Eekelen, Daphne N. Voormolen, Harold W. de Valk, Inge M. Evers, Ben Willem Mol, Arie Franx, Sarah E. Siegelaar, Bas B. van Rijn, J. Hans DeVries, Rebecca C. Painter
Diabetes, Obesity and Metabolism.2023; 25(12): 3798. CrossRef - Regimen comprising GLP-1 receptor agonist and basal insulin can decrease the effect of food on glycemic variability compared to a pre-mixed insulin regimen
Yi-Hsuan Lin, Chia-Hung Lin, Yu-Yao Huang, Hsin-Yun Chen, An-Shun Tai, Shih-Chen Fu, Sheng-Hwu Hsieh, Jui-Hung Sun, Szu-Tah Chen, Sheng-Hsuan Lin
European Journal of Medical Research.2022;[Epub] CrossRef - Advantages of Applying Artificial Intelligent System to Medical Neurology (Preprint)
Zhenqiang Fu, Jingtao Wang, Jingtao Wang
JMIR Medical Informatics.2020;[Epub] CrossRef - Comparison of Glucose Area Under the Curve Measured Using Minimally Invasive Interstitial Fluid Extraction Technology with Continuous Glucose Monitoring System in Diabetic Patients
Mei Uemura, Yutaka Yano, Toshinari Suzuki, Taro Yasuma, Toshiyuki Sato, Aya Morimoto, Samiko Hosoya, Chihiro Suminaka, Hiromu Nakajima, Esteban C. Gabazza, Yoshiyuki Takei
Diabetes & Metabolism Journal.2017; 41(4): 265. CrossRef
 PubReader
 Cite
Cite