
- Current
- Browse
- Collections
-
For contributors
- For Authors
- Instructions to authors
- Article processing charge
- e-submission
- For Reviewers
- Instructions for reviewers
- How to become a reviewer
- Best reviewers
- For Readers
- Readership
- Subscription
- Permission guidelines
- About
- Editorial policy
Articles
- Page Path
- HOME > Diabetes Metab J > Ahead-of print > Article
-
Original ArticleMetabolic Risk/Epidemiology Biologically Informed Polygenic Scores for Brain Insulin Receptor Network Are Associated with Cardiometabolic Risk Markers and Diabetes in Women
-
Jannica S. Selenius1,2
 , Patricia P. Silveira3,4, Mikaela von Bonsdorff1,5, Jari Lahti6,7, Hannu Koistinen8, Riitta Koistinen8, Markku Seppälä9, Johan G. Eriksson1,2,10,11, Niko S. Wasenius1,2
 -
DOI: https://doi.org/10.4093/dmj.2023.0039
Published online: March 25, 2024
- 786 Views
- 23 Download
1Folkhälsan Research Center, Helsinki, Finland
2Department of General Practice and Primary Health Care, Helsinki University Hospital, University of Helsinki, Helsinki, Finland
3Department of Psychiatry, Faculty of Medicine, McGill University, Verdun, QC, Canada
4Ludmer Center for Neuroinformatic and Mental Health, Douglas Mental Health University Institute, McGill University, Verdun, QC, Canada
5Gerontology Research Center and Faculty of Sport and Health Sciences, University of Jyväskylä, Jyväskylä, Finland
6Department of Psychology and Logopedics, University of Helsinki, Helsinki, Finland
7Turku Institute for Advanced Studies, University of Turku, Turku, Finland
8Department of Clinical Chemistry and Haematology, Helsinki University Hospital, Faculty of Medicine, University of Helsinki, Helsinki, Finland
9Department of Clinical Chemistry and Obstetrics and Gynecology, Helsinki University Hospital, University of Helsinki, Helsinki, Finland
10Department of Obstetrics & Gynecology and Human Potential Translational Research Program, Yong Loo Lin School of Medicine, National University of Singapore, Singapore
11Singapore Institute for Clinical Sciences (SICS), Agency for Science, Technology and Research (A*STAR), Singapore
- Corresponding author: Jannica S. Selenius Department of General Practice and Primary Health Care, Helsinki University Hospital, University of Helsinki, Yliopistokatu 3, 00140, Helsinki, Finland E-mail: jannica.selenius@helsinki.fi
Copyright © 2024 Korean Diabetes Association
This is an Open Access article distributed under the terms of the Creative Commons Attribution Non-Commercial License (http://creativecommons.org/licenses/by-nc/4.0/) which permits unrestricted non-commercial use, distribution, and reproduction in any medium, provided the original work is properly cited.
ABSTRACT
-
Background
- To investigate associations between variations in the co-expression-based brain insulin receptor polygenic score and cardiometabolic risk factors and diabetes mellitus.
-
Methods
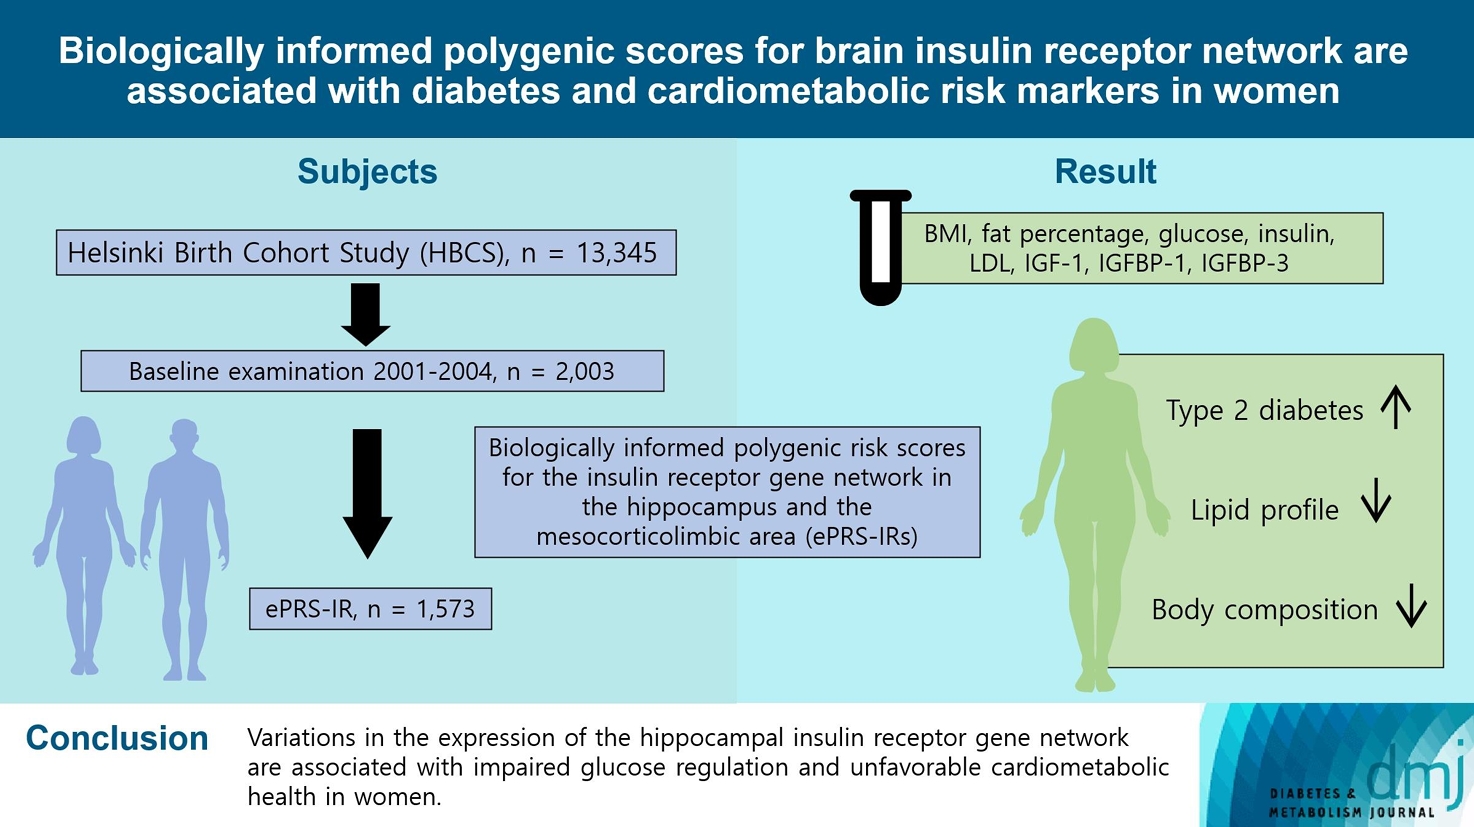
- This cross-sectional study included 1,573 participants from the Helsinki Birth Cohort Study. Biologically informed expression-based polygenic risk scores for the insulin receptor gene network were calculated for the hippocampal (hePRS-IR) and the mesocorticolimbic (mePRS-IR) regions. Cardiometabolic markers included body composition, waist circumference, circulating lipids, insulin-like growth factor 1 (IGF-1), and insulin-like growth factor-binding protein 1 and 3 (IGFBP-1 and -3). Glucose and insulin levels were measured during a standardized 2-hour 75 g oral glucose tolerance test and impaired glucose regulation status was defined by the World Health Organization 2019 criteria. Analyzes were adjusted for population stratification, age, smoking, alcohol consumption, socioeconomic status, chronic diseases, birth weight, and leisure-time physical activity.
-
Results
- Multinomial logistic regression indicated that one standard deviation increase in hePRS-IR was associated with increased risk of diabetes mellitus in all participants (adjusted relative risk ratio, 1.17; 95% confidence interval, 1.01 to 1.35). In women, higher hePRS-IR was associated with greater waist circumference and higher body fat percentage, levels of glucose, insulin, total cholesterol, low-density lipoprotein cholesterol, triglycerides, apolipoprotein B, insulin, and IGFBP-1 (all P≤0.02). The mePRS-IR was associated with decreased IGF-1 level in women (P=0.02). No associations were detected in men and studied outcomes.
-
Conclusion
- hePRS-IR is associated with sex-specific differences in cardiometabolic risk factor profiles including impaired glucose regulation, abnormal metabolic markers, and unfavorable body composition in women.
- • ePRSs, based on co-expression, reflect tissue-specific biological functions.
- • ePRSs associated with the insulin receptor gene network are linked to type 2 diabetes.
- • Corresponding links were with adverse lipid profiles and body composition.
- • These associations were seen in the hippocampal area, exclusively among older women.
- • The brain insulin receptor gene network appears to influence cardiometabolic risk.
Highlights
- The human brain was once thought to be insensitive to insulin. Cumulative evidence from past decades has since confirmed the existence of central insulin activity and its critical role in cognition and metabolism [1].
- Central insulin activity has been proposed to be an essential regulator of peripheral glucose homeostasis [2]. In animal models, insulin receptors are expressed on the endothelial cells of the brain blood barrier, suggesting transportation of peripheral insulin into the brain, as well as in a broad range of brain areas, including the limbic regions, the hypothalamus and the hippocampus [3,4]. Through insulin receptor signaling, central insulin action has been found to regulate food intake [5] and to reduce hepatic glucose production [6]. In addition, brain insulin resistance compromises the dopaminergic system which in turn increases energy intake and peripheral glucose levels [5].
- Central insulin activity further affects fat metabolism. Central insulin sensitivity is associated with more favorable fat metabolism [7], while hypothalamic insulin resistance participates in the development of obesity [8]. Furthermore, while studies investigating peripheral insulin sensitivity and central insulin activity have provided mixed findings, with some studies demonstrating that insulin resistance in obese subjects reduces transportation of insulin into the brain [9,10] and other studies have shown that peripheral hyperinsulinemia and impaired glucose tolerance are associated with higher brain glucose uptake [11,12], it is clear that peripheral and central insulin sensitivity are closely linked. Sequentially, adverse cardiometabolic health, diabetes mellitus (DM), and unfavorable fat metabolism are closely associated with impairment in brain insulin signaling [13,14].
- Brain insulin action has largely been investigated in animal models. In humans, central insulin resistance has been examined by applying neuroimaging techniques and administrating intranasal insulin [15], as well as by approaching it from a genetic perspective, for example by employing polygenic risk scores (PRSs). However, conventional PRSs often fail to take into account that genes operate in networks and have tissue-specific biological functions. Thus, a recent study developed expression-based genetic scores for mesocorticolimbic and hippocampal insulin receptor-related gene networks in order to enhance traditional PRSs [16]. With this approach, it was shown that brain region specific, biologically informed PRSs for the insulin receptor gene network (ePRS-IRs) were more strongly associated with Alzheimer’s disease, addiction and childhood impulsivity than the traditional PRSs [16].
- The ePRS-IRs are devised using gene co-expression data (in a given tissues), which allows identification of gene co-expression networks. Single nucleotide polymorphisms (SNPs) of these genes are then used for the calculation of the ePRS-IRs. The SNPs from the network genes are functionally annotated and subjected to linkage disequilibrium clumping for removal of highly correlated SNPs. Then a count function of the number of alleles at a given SNP, weighted by the effect size of the association between the individual SNP and gene expression data in that specific tissue, is performed using Genotype-Tissue Expression (GTeX) [17]. The sum of these values from the total number of SNPs provides the ePRS-IRs. The ePRS-IR aggregates information on the relationship between the gene of interest and other genes in the genome, the levels of tissue-specific gene expression, the genetic variation of the target sample (given by the genotyping data) and the tissue-specific effect size of the association between genotyping and gene expression (given by GTeX). Therefore, variations in the ePRS-IR represent individual variations in the expression of the tissue-specific gene co-expression network [18]. In the case of our study, variations in the ePRS-IR represent individual variations in the expression of the insulin receptor gene network in the mesocorticolimbic area or in the hippocampus.
- Although widely employed in a range of fields, PRSs have not previously been applied to investigate central insulin receptor mediated pathways and metabolic factors. Overall, research on the genetic predisposition for central insulin action and peripheral metabolism has been scarce. While there is evidence that insulin receptors are expressed in the hippocampus and the mesocorticolimbic area, research on whether the variation in expression of the insulin receptors in these areas is associated with peripheral glucose and energy homeostasis has not been conducted.
- In this study, we aim to employ these novel ePRS-IRs to assess the association between the central insulin receptor gene network in the hippocampus and the mesocorticolimbic area, and markers of cardiometabolic health and DM among older men and women.
INTRODUCTION
- Participants
- The Helsinki Birth Cohort Study (HBCS) includes 13,345 individuals who were born between 1934 and 1944 at the Helsinki University Central Hospital (HUCH) or the Helsinki City Maternity Hospital [19] and attended child welfare clinics in Helsinki. Those individuals who were living in Finland in 1971 received a unique personal identification number, as did all individuals of the Finnish population. Out of 8,760 individuals born at HUCH, 2,902 were randomly selected and invited to the clinical cohort. Between 2001 and 2004, a baseline clinical examination was conducted involving 2003 cohort members. Of those, 1,573 had sufficient data after excluding individuals with missing information on ePRS-IRs (n=383), socioeconomic status (SES, n=4), population stratification (n=1), leisure-time physical activity (LTPA, n=29), chronic diseases (n=2), alcohol consumption (n=6), and smoking (n=5). Data on circulating insulin-like growth factor 1 (IGF-1), insulin-like growth factor-binding protein 1 (IGFBP-1) and 3 (IGFBP-3) levels were available only a random subsample of individuals who participated in clinical measurements in 2003 or earlier (n=454) [20]. The study was approved by the Ethics Committee of Epidemiology and Public Health of the Hospital District of Helsinki and Uusimaa (344/E3/2000) and that of the National Public Health Institute, Helsinki and follows the guidelines of the Declaration of Helsinki. All participants gave a written informed consent before participating in the study.
- Expression-based polygenic risk score for brain insulin receptor network
- Genotyping and ePRS-IR calculation were performed as previously described [16]. According to standard protocols, DNA was extracted from blood samples and genotyping was performed with the modified Illumina 610 k chip by the Wellcome Trust Sanger Institute (Cambridge, UK). Genomic coverage was extended by imputation using the 1000 Genomes Phase I integrated variant set (v3/April 2012; NCBI build 37/hg19) as the reference sample and IMPUTE2 software (https://mathgen.stats.ox.ac.uk/impute/impute_v2.html). Before imputing, quality control filters were applied by setting SNP clustering probability for each genotype at >95%, call rate at >95% for individuals and markers (99% for markers with minor allele frequency [MAF] <5%), MAF at >1%, and the P value for the Hardy-Weinberg Equilibrium exact test P>1×10⁻⁶. In addition, heterozygosity and gender and relatedness checks were performed and any discrepancies removed. The total number of SNPs in the imputed data was 39282668.
- For the ePRS calculation, lists of genes co-expressed with the insulin receptor in the mesocorticolimbic system or hippocampus were created. SNPs from these gene networks were mapped, and the list of SNPs was submitted to linkage disequilibrium clumping. In HBCS, the clumped list of SNPs was weighted with the betas from the GTeX, a resource database and tissue bank for studying the relationship between genetic variation and gene expression in human tissues, using data from each respective brain region. The selection of the SNPs within a given clumping window was based on the lowest P value. Thus, biologically informed mesocorticolimbic (mePRS-IR) and hippocampal (hePRS-IR) specific co-expression-based polygenic scores for the insulin receptor gene network were calculated. For the analyses both hePRS-IR and mePRS-IR were standardized and reported as z-scores. For further details on calculation examples, please see the reference article [16].
- Prediabetes and diabetes mellitus
- At the time of the clinical examination, fasting plasma glucose was measured in all individuals. A standard 2-hour 75 g oral glucose tolerance test (OGTT) was applied for measuring glucose and insulin levels, as well as for diagnosing DM according to the World Health Organization (WHO) 2019 criteria [21]. Individuals who met the WHO 2019 criteria for impaired fasting glucose or impaired glucose tolerance during the OGTT were considered to have prediabetes. In addition, information on diabetes medication was collected from the Finnish national medication database, and individuals who received DM medication at the age of 40 or older were considered to have type 2 diabetes mellitus (T2DM). The Finnish national prescription drug reimbursement register has previously been compared with the national hospital discharge register and have shown that around 90% of those diagnosed and receiving medication for DM after the age 40 years have T2DM. Impaired glucose regulation status was available from 1,570 participants.
- Body composition and anthropometrics
- Height was measured with a stadiometer (KaWe), and weight with medical scales (alpha 770, SECA, Hamburg, Germany). Body mass index was calculated as weight in kilograms divided with height in meters squared. Waist circumference in centimeters was measured twice with a soft tape from the midpoint between lowest rib and iliac crest and the mean of the two measurement was reported. Body composition including body fat percentage, fat mass, and lean body mass was assessed by bioimpedance (InBody 3.0, Biospace Co. Ltd., Seoul, Korea) [22].
- Blood testing and analyses
- In the OGTT, we measured plasma glucose and insulin at the time of fasting, 30 minutes and 2 hours. Plasma glucose concentrations were determined with a hexokinase method and plasma insulin was measured with 2-site immunometric assays. Fasting plasma samples were used to measure serum total cholesterol, high-density lipoprotein cholesterol (HDL-C), low-density lipoprotein cholesterol (LDL-C), triglycerides, apolipoprotein A, and apolipoprotein B concentrations with standard enzymatic methods. Circulating IGF-1 was measured by an IGF-1 enzyme-linked immunosorbent assay (ELISA) kit (DSL-10-5600, Diagnostic Systems Laboratories Inc., Webster, TX, USA). Serum IGFBP-1 was measured by sandwich-type immunofluorometry, as reported previously [20], and serum IGFBP-3 was measured by an immunofluorometric assay, using monoclonal antibodies (1B6/5C11) against IGFBP-3 [23]. Insulin resistance and β-cell function were determined by the homeostasis model assessment (HOMA), calculated by the formulas: HOMA-IR=(fasting glucose×fasting insulin)/22.5 [24] and HOMA-β=20×fasting insulin/(fasting glucose–3.5) [25]. The insulinogenic index was calculated as the ratio of the change in insulin and glucose responses from 0 to 30 minutes [26,27]. The analyses above were performed in an accredited hospital laboratory (Huslab, Helsinki, Finland).
- Covariates
- Smoking was coded as never, former, and current. Alcohol consumption was coded as never or having quit, less than once a week, or weekly. Highest attained SES was obtained from Statistics Finland and coded as high official, low official, self-employed, and manual workers [28]. The subjects’ past 12-month LTPA was assessed by the validated LTPA questionnaire; the Kuopio Ischemic Heart Disease Risk Factor Study (KIHD) [29]. As previously suggested [30], LTPA was measured in metabolic equivalents of task (MET) [31], which were multiplied with time (hours) and frequency to calculate MET-hours. Through validated questionnaires about chronic diseases, subjects were asked about any health conditions. Conditions included DM, cardiovascular conditions (congestive heart failure, arrhythmias, claudication, angina pectoris, previous heart attack, and stroke), lung diseases (asthma, emphysema, and chronic bronchitis), musculoskeletal disorders (rheumatoid arthritis and osteoporosis), and presence of cancer. The presence of comorbidities was coded as none, one, or two or more. Information on birth weight was retrieved from child welfare clinics as previously described [32]. Birth weight was coded as <3,000, 3,000–3,499, and ≥3,500 g. Self-reported diabetes medication was categorized as 0 (no diabetes medication) and 1 (usage of diabetes medication).
- Statistical analysis
- The data are reported as means (standard deviation or 95% confidence intervals [CIs]), medians (interquartile range) or counts (percentage). Analysis of variance was applied for continuous variables and chi-square test for categorical variables when analyzing the baseline characteristics. Multinomial logistic regression was applied to investigate the association between diabetes status (normoglycemia, prediabetes, DM) and the PRS-IRs and reported as relative risk ratios (RRR). Linear regression analyses were employed to investigate the association between the ePRSIRs and continuous variables. The bootstrap method with 5,000 repetitions was used to calculate 95% CIs. All analyses were performed separately for men and women as the body composition between the sexes differ. The crude analyses were adjusted for age and population stratification [33,34]. Fully adjusted models were additionally adjusted for age, smoking, alcohol consumption, SES, presence of chronic diseases, birth weight, and LTPA. Sensitivity analyses were applied for investigating the interaction between the self-reported diabetes medication and ePRSs and also diabetes status and ePRSs on continuous outcomes. A P<0.05 was considered to be statistically significant. Statistical analyses were carried out using Stata/MP version 16.1 (Stata Corporation, College Station, TX, USA).
- Data availability
- The data analyzed during the current study are available from the corresponding author on reasonable request.
METHODS
- This study included 1,573 participants from the HBCS, of which 889 were women. The characteristics of the study population are presented in Table 1.
- Body composition and anthropometrics
- In women, higher hePRS-IR was associated with greater waist circumference and fat mass as well as higher body fat percentage (Table 2). No association was detected between the hePRS-IR and lean body mass. mePRS-IR was not associated with any of the body composition or anthropometric measure etiher in men or women.
- Glucose metabolism
- Higher hePRS-IR was associated with higher glucose concentrations at 2-hour in the OGTT in women but not men (Table 2). hePRS-IR was associated with higher glucose concentrations at 30 minutes in the OGTT in the crude model (P=0.02), but after adjusting for confounding factors this association weakened slightly (P=0.05). No association was found for mePRS-IR in women or men.
- Insulin metabolism
- In women, higher hePRS-IR was linked with higher fasting insulin concentrations as well as insulin concentrations at 30 minutes and 2 hours. None of these associations were evident in men. No associations were found for mePRS-IR and markers of insulin metabolism.
- Diabetes mellitus
- When analyzing all participants, a one standard deviation increase in hePRS-IR increased the risk for prediabetes by 12% (RRR, 1.12; 95% CI, 1.00 to 1.26) and for DM by 17% (RRR, 1.17; 95% CI, 1.01 to 1.35) (Fig. 1). This association seemed to be stronger in women (RRR, 1.23; 95% CI, 0.99 to 1.54), although this was not statistically significant. No associations were found in men, nor for either men or women for the mePRS-IR.
- Lipid metabolism
- Higher hePRS-IR was associated with higher levels of total cholesterol, LDL-C, triglycerides, and apolipoprotein B, and with lower levels of HDL-C. No significant associations were evident in the mePRS-IR (Table 3).
- Subsample analyses
- We investigated the association between the ePRS-IRs and IGF-1, IGFBP-1, and IGFBP-3 from a subsample of participants. In this subsample of women, higher hePRS-IR was associated with lower levels of IGFBP-1 (b=–17.1; 95% CI, –28.5 to –5.8) (Supplementary Table 1). However, in men, higher mePRS-IR was linked to lower levels of IGFBP-1 (b=–11.1; 95% CI, –21.8 to –0.5).
- Sensitivity analyses
- No significant diabetes medication by ePRSs interaction term was found for any of the investigated continuous variables either in crude or fully adjusted models (Supplementary Table 2). We also investigated the interaction between the diabetes status and ePRSs on continuous outcomes. We found no significant interaction between the diabetes status by ePRSs on any of the variables in women (Supplementary Table 3). In men, however, there was a significant interaction effect on IGF-1 (P for interaction=0.014 for crude and 0.01 for full model), apolipoprotein A (P for interaction=0.04 for crude and 0.044 for full model), and for triglycerides (P for interaction=0.048 for crude and 0.056 for full model) (Supplementary Table 4).
RESULTS
- There are significant biological differences between men and women that probably contribute to sex-specific differences in cardiovascular disease risk factors as well as treatment and prognosis. It is essential to understand these sex differences in order to get a better understanding of the pathophysiology and to optimize management of cardiovascular disease in both genders. In the present study we observed an association between hePRS-IR and an increased risk for T2DM which seemed to be stronger in women. We also detected an association between hePRS-IR and unfavorable cardiometabolic health, such as poorer lipid profile and body composition in women but not in men. Diabetes medication did not affect the results, and diabetes status only displayed a marginal effect on the association between the ePRS and studied outcomes in men, not in women.
- The ePRS-IRs reflect biological function of the insulin receptor gene network. The association between the hePRS-IR and peripheral glucose and insulin levels points to central insulin metabolism as regulator of systemic glucose homeostasis. Previous studies have suggested that while peripheral insulin acts mostly as a metabolic regulatory hormone, central insulin has a range of effects in the brain with paramount systemic effects [35]. In turn, impaired systemic glucose homeostasis is a hallmark of the metabolic syndrome [13] and T2DM [36]. We also detected an increased risk for T2DM in individuals with higher expression of the hePRS-IR, which further supports our hypothesis that variation in the function of central insulin receptors has peripheral outcomes.
- The hePRS-IR was also associated with poorer lipid profile and unfavorable body composition. This is in line with previous research in which adiposity has been found to be accompanied by alterations in brain insulin action—more so in women [36]. Intact central insulin signaling has been proposed to reduce increase in body weight [14], while disruption of normal insulin action in the brain has been found to lead to obesity through excessive food intake [37]. Moreover, obesity is often accompanied by increased levels of cardiovascular risk factors including dyslipidemia that was associated with higher hePRS in our study.
- Obesity along with disturbed glucose regulation is accompanied by aberrant levels of several of the measured biomarkers in our study. Apolipoprotein A deficiency is associated with atherosclerosis and DM [38], while increased levels of apolipopeotein B contributes to hyperlipidemia [39]. IGFBP-1, which in our study was decreased in women with higher hePRS-IR, has been proposed to be a marker for insulin sensitivity [40], in addition to being inversely associated with hyperinsulinemia in postmenopausal women [41]. These biomarkers were associated with the hePRS-IR, which could reflect that the scores were intended to indeed capture biological function rather than specific disorders.
- In our study, the associations between the brain insulin receptor gene network and disturbances in glucose regulation and body composition were seen only in women. Insulin-related metabolic conditions have previously been found to be overrepresented in women, especially after menopause due to the progressive loss of estrogen and its interactions with insulin [42]. Explanations for this include that the pre-menopausal protecting effect of estrogen on insulin resistance and T2DM disappears [43], resulting in a deteriorated metabolism in the brain [44]. Indeed, the female participants in our study population are postmenopausal. In addition, female over-representation of impaired glucose regulation has been attributed to sex differences in body composition [45]. In our study populations, hePRS-IR in women was associated with increased fat mass and waist circumference, which could contribute to the observed.
- Consistently throughout our study, only the hePRS-IR was found to display any significant associations. A possible explanation for the associations being seen only with the hePRS-IR and not with the mePRS-IR might be due to the higher level of gene expression for IR in the hippocampus than the mesocorticolimbic system. Moreover, the co-expression gene network in the hippocampus is much larger, and therefore the signal captured by the hePRS-IR more aligned with insulin function in a broader way, as suggested by the results.
- There are several strengths as well as limitations to our study. The HBCS is a well-characterized cohort which include the use of reliable measurements from the clinical examinationand. We applied both clinical and register-based data in the analyses. We were also able to measure a variety of different markers of cardiometabolic health. Information on diabetes status was collected based on OGTT performed during the study visit. Regarding the ePRSs, they have the potential to enhance disease diagnosing and treatment when applied in combination with other clinical risk factors and disease manifestations. The limitations to our study include the fact that the participants come from a homogenous, restricted area of Finland, which may affect generalizability and applicability of our results. Body composition was assessed with bioimpedance which is not the golden standard; however, bioimpedance does accurately measure a wide range of adiposity.
- To conclude, variations in hippocampal insulin receptor gene network expression were associated with impaired glucose regulation and unfavorable cardiometabolic health in women. Thus, our research extends on previous work and offers further insight into the underlying pathological features associated with DM, obesity and cardiometabolic health, and by doing so, contributes to the understanding of these diseases and how to prevent them.
DISCUSSION
SUPPLEMENTARY MATERIALS
Supplementary Table 1.
Supplementary Table 2.
Supplementary Table 3.
Supplementary Table 4.
-
CONFLICTS OF INTEREST
No potential conflict of interest relevant to this article was reported.
-
AUTHOR CONTRIBUTIONS
Conception or design: J.S.S., J.G.E., N.S.W.
Acquisition, analysis, interpretation of data: J.S.S., P.P.S., J.L., J.G.E., N.S.W.
Drafting the work or revising: all authors.
Final approval of the manuscript: J.S.S., P.P.S., J.L., H.K., R.K., M.S., J.G.E., N.S.W.
-
FUNDING
This study was supported by the Finnish Foundation for Cardiovascular Research, Finnish Foundation for Diabetes Research, Juho Vainio Foundation, Academy of Finland, Novo Nordisk Foundation, Signe and Ane Gyllenberg Foundation, Samfundet Folkhälsan, Finska Läkaresällskapet, Liv och Hälsa, European Commission FP7 (DORIAN) Grant Agreement No. 278603 and EU H2020-PHC-2014-DynaHealth Grant No. 633595 and EU Horizon 2020 Award 733206 LIFECYCLE. Patricia P. Silveira is supported by Canadian Institutes of Health Research (CIHR, PJT-166066, PI Patricia P. Silveira). Hannu Koistinen is supported by Sigrid Jusélius Foundation.
NOTES
-
Acknowledgements
- The authors would like to express their gratitude to the participants in the Helsinki Birth Cohort Study. We thank Annikki Löfhjelm for technical assistance.

Values are presented as mean±standard deviation, number (%), or median (interquartile range).
SES, socioeconomic status; BMI, body mass index; BP, blood pressure; HDL-C, high-density lipoprotein cholesterol; LDL-C, low-density lipoprotein cholesterol; HOMA-IR, homeostatic model of assessment of insulin resistance; HOMA-β, homeostatic model of assessment of β-cell function; IGI, insulinogenic index; IGF-1, insulin growth factor 1; IGFBP-1, insulin growth factor-binding protein 1; IGFBP-3, insulin growth factor-binding protein 3; LTPA, leisure-time physical activity; METh, metabolic equivalents of task hours.
Crude models are adjusted for age and population stratification. Fully adjusted models are additionally adjusted for age, smoking, alcohol consumption, socioeconomic status, presence of chronic diseases, birth weight, and leisure-time physical activity.
hePRS-IR, polygenic risk score for the hippocampal-insulin receptor; CI, confidence interval; HDL-C, high-density lipoprotein cholesterol; LDL-C, low-density lipoprotein cholesterol; HOMA-IR, homeostatic model of assessment of insulin resistance; HOMA-β, homeostatic model of assessment of β-cell function; IGI, insulinogenic index.
Crude models are adjusted for age and population stratification. Fully adjusted models are additionally adjusted for age, smoking, alcohol consumption, socioeconomic status, presence of chronic diseases, birth weight, and leisure-time physical activity.
mePRS-IR, polygenic risk score for the mesocorticolimbic-insulin receptor; CI, confidence interval; HDL-C, high-density lipoprotein cholesterol; LDL-C, low-density lipoprotein cholesterol; HOMA-IR, homeostatic model of assessment of insulin resistance; HOMA-β, homeostatic model of assessment of β-cell function; IGI, insulinogenic index.
- 1. Pomytkin I, Costa-Nunes JP, Kasatkin V, Veniaminova E, Demchenko A, Lyundup A, et al. Insulin receptor in the brain: mechanisms of activation and the role in the CNS pathology and treatment. CNS Neurosci Ther 2018;24:763-74.ArticlePubMedPMCPDF
- 2. Grillo CA, Woodruff JL, Macht VA, Reagan LP. Insulin resistance and hippocampal dysfunction: disentangling peripheral and brain causes from consequences. Exp Neurol 2019;318:71-7.ArticlePubMed
- 3. Landau BR, Takaoka Y, Abrams MA, Genuth SM, van Houten M, Posner BI, et al. Binding of insulin by monkey and pig hypothalamus. Diabetes 1983;32:284-91.ArticlePubMed
- 4. Hill JM, Lesniak MA, Pert CB, Roth J. Autoradiographic localization of insulin receptors in rat brain: prominence in olfactory and limbic areas. Neuroscience 1986;17:1127-38.ArticlePubMed
- 5. Woods CA, Guttman ZR, Huang D, Kolaric RA, Rabinowitsch AI, Jones KT, et al. Insulin receptor activation in the nucleus accumbens reflects nutritive value of a recently ingested meal. Physiol Behav 2016;159:52-63.ArticlePubMedPMC
- 6. Petersen MC, Shulman GI. Mechanisms of insulin action and insulin resistance. Physiol Rev 2018;98:2133-223.ArticlePubMedPMC
- 7. Kullmann S, Valenta V, Wagner R, Tschritter O, Machann J, Haring HU, et al. Brain insulin sensitivity is linked to adiposity and body fat distribution. Nat Commun 2020;11:1841.ArticlePubMedPMCPDF
- 8. Chen W, Balland E, Cowley MA. Hypothalamic insulin resistance in obesity: effects on glucose homeostasis. Neuroendocrinology 2017;104:364-81.ArticlePubMedPDF
- 9. Banks WA, Jaspan JB, Kastin AJ. Selective, physiological transport of insulin across the blood-brain barrier: novel demonstration by species-specific radioimmunoassays. Peptides 1997;18:1257-62.ArticlePubMed
- 10. Kaiyala KJ, Prigeon RL, Kahn SE, Woods SC, Schwartz MW. Obesity induced by a high-fat diet is associated with reduced brain insulin transport in dogs. Diabetes 2000;49:1525-33.ArticlePubMedPDF
- 11. Bahri S, Horowitz M, Malbert CH. Inward glucose transfer accounts for insulin-dependent increase in brain glucose metabolism associated with diet-induced obesity. Obesity (Silver Spring) 2018;26:1322-31.ArticlePubMedPDF
- 12. Rebelos E, Bucci M, Karjalainen T, Oikonen V, Bertoldo A, Hannukainen JC, et al. Insulin resistance is associated with enhanced brain glucose uptake during euglycemic hyperinsulinemia: a large-scale PET cohort. Diabetes Care 2021;44:788-94.ArticlePubMedPMCPDF
- 13. Kleinridders A, Ferris HA, Cai W, Kahn CR. Insulin action in brain regulates systemic metabolism and brain function. Diabetes 2014;63:2232-43.ArticlePubMedPMCPDF
- 14. Wardelmann K, Blumel S, Rath M, Alfine E, Chudoba C, Schell M, et al. Insulin action in the brain regulates mitochondrial stress responses and reduces diet-induced weight gain. Mol Metab 2019;21:68-81.ArticlePubMedPMC
- 15. Novak V, Milberg W, Hao Y, Munshi M, Novak P, Galica A, et al. Enhancement of vasoreactivity and cognition by intranasal insulin in type 2 diabetes. Diabetes Care 2014;37:751-9.ArticlePubMedPMCPDF
- 16. Hari Dass SA, McCracken K, Pokhvisneva I, Chen LM, Garg E, Nguyen TT, et al. A biologically-informed polygenic score identifies endophenotypes and clinical conditions associated with the insulin receptor function on specific brain regions. EBioMedicine 2019;42:188-202.ArticlePubMedPMC
- 17. GTEx Consortium. The Genotype-Tissue Expression (GTEx) project. Nat Genet 2013;45:580-5.PubMedPMC
- 18. Silveira PP, Meaney MJ. Examining the biological mechanisms of human mental disorders resulting from gene-environment interdependence using novel functional genomic approaches. Neurobiol Dis 2023;178:106008.ArticlePubMed
- 19. von Bondorff MB, Tormakangas T, Salonen M, von Bonsdorff ME, Osmond C, Kajantie E, et al. Early life origins of all-cause and cause-specific disability pension: findings from the Helsinki Birth Cohort Study. PLoS One 2015;10:e0122134.ArticlePubMedPMC
- 20. Koistinen H, Koistinen R, Selenius L, Ylikorkala Q, Seppala M. Effect of marathon run on serum IGF-I and IGF-binding protein 1 and 3 levels. J Appl Physiol (1985) 1996;80:760-4.ArticlePubMed
- 21. World Health Organization. Classification of diabetes mellitus Geneva: WHO; 2019.
- 22. Bedogni G, Malavolti M, Severi S, Poli M, Mussi C, Fantuzzi AL, et al. Accuracy of an eight-point tactile-electrode impedance method in the assessment of total body water. Eur J Clin Nutr 2002;56:1143-8.ArticlePubMedPDF
- 23. Koistinen H, Seppala M, Koistinen R. Different forms of insulin-like growth factor-binding protein-3 detected in serum and seminal plasma by immunofluorometric assay with monoclonal antibodies. Clin Chem 1994;40:531-6.ArticlePubMedPDF
- 24. Matthews DR, Hosker JP, Rudenski AS, Naylor BA, Treacher DF, Turner RC. Homeostasis model assessment: insulin resistance and beta-cell function from fasting plasma glucose and insulin concentrations in man. Diabetologia 1985;28:412-9.ArticlePubMedPDF
- 25. Song Y, Manson JE, Tinker L, Howard BV, Kuller LH, Nathan L, et al. Insulin sensitivity and insulin secretion determined by homeostasis model assessment and risk of diabetes in a multiethnic cohort of women: the Women’s Health Initiative Observational Study. Diabetes Care 2007;30:1747-52.ArticlePubMedPDF
- 26. Phillips DI, Clark PM, Hales CN, Osmond C. Understanding oral glucose tolerance: comparison of glucose or insulin measurements during the oral glucose tolerance test with specific measurements of insulin resistance and insulin secretion. Diabet Med 1994;11:286-92.ArticlePubMed
- 27. Seltzer HS, Allen EW, Herron AL Jr, Brennan MT. Insulin secretion in response to glycemic stimulus: relation of delayed initial release to carbohydrate intolerance in mild diabetes mellitus. J Clin Invest 1967;46:323-35.ArticlePubMedPMC
- 28. Central Statistical Office of Finland. Classification of socio-economic group: handbooks 17. 17th ed. Helsinki: Central Statistical Office of Finland; 1989.
- 29. Lakka TA, Venalainen JM, Rauramaa R, Salonen R, Tuomilehto J, Salonen JT. Relation of leisure-time physical activity and cardiorespiratory fitness to the risk of acute myocardial infarction. N Engl J Med 1994;330:1549-54.ArticlePubMed
- 30. Wasenius N, Venojarvi M, Manderoos S, Surakka J, Lindholm H, Heinonen OJ, et al. Unfavorable influence of structured exercise program on total leisure-time physical activity. Scand J Med Sci Sports 2014;24:404-13.ArticlePubMed
- 31. Alberti KG, Zimmet PZ. Definition, diagnosis and classification of diabetes mellitus and its complications. Part 1: diagnosis and classification of diabetes mellitus provisional report of a WHO consultation. Diabet Med 1998;15:539-53.ArticlePubMed
- 32. Eriksson JG, Forsen T, Tuomilehto J, Winter PD, Osmond C, Barker DJ. Catch-up growth in childhood and death from coronary heart disease: longitudinal study. BMJ 1999;318:427-31.ArticlePubMedPMC
- 33. Price AL, Patterson NJ, Plenge RM, Weinblatt ME, Shadick NA, Reich D. Principal components analysis corrects for stratification in genome-wide association studies. Nat Genet 2006;38:904-9.ArticlePubMedPDF
- 34. Patterson N, Price AL, Reich D. Population structure and eigenanalysis. PLoS Genet 2006;2:e190.ArticlePubMedPMC
- 35. Banks WA, Owen JB, Erickson MA. Insulin in the brain: there and back again. Pharmacol Ther 2012;136:82-93.ArticlePubMedPMC
- 36. Kullmann S, Heni M, Hallschmid M, Fritsche A, Preissl H, Haring HU. Brain insulin resistance at the crossroads of metabolic and cognitive disorders in humans. Physiol Rev 2016;96:1169-209.ArticlePubMed
- 37. Brüning JC, Gautam D, Burks DJ, Gillette J, Schubert M, Orban PC, et al. Role of brain insulin receptor in control of body weight and reproduction. Science 2000;289:2122-5.ArticlePubMed
- 38. Qu J, Ko CW, Tso P, Bhargava A. Apolipoprotein A-IV: a multifunctional protein involved in protection against atherosclerosis and diabetes. Cells 2019;8:319.ArticlePubMedPMC
- 39. Morita SY. Metabolism and modification of apolipoprotein Bcontaining lipoproteins involved in dyslipidemia and atherosclerosis. Biol Pharm Bull 2016;39:1-24.ArticlePubMed
- 40. Borai A, Livingstone C, Zarif H, Ferns G. Serum insulin-like growth factor binding protein-1: an improvement over other simple indices of insulin sensitivity in the assessment of subjects with normal glucose tolerance. Ann Clin Biochem 2009;46(Pt 2):109-13.ArticlePubMedPDF
- 41. Mogul HR, Marshall M, Frey M, Burke HB, Wynn PS, Wilker S, et al. Insulin like growth factor-binding protein-1 as a marker for hyperinsulinemia in obese menopausal women. J Clin Endocrinol Metab 1996;81:4492-5.ArticlePubMed
- 42. Duarte AI, Santos MS, Oliveira CR, Moreira PI. Brain insulin signalling, glucose metabolism and females’ reproductive aging: a dangerous triad in Alzheimer’s disease. Neuropharmacology 2018;136(Pt B):223-42.ArticlePubMed
- 43. Carr MC. The emergence of the metabolic syndrome with menopause. J Clin Endocrinol Metab 2003;88:2404-11.ArticlePubMed
- 44. Rettberg JR, Yao J, Brinton RD. Estrogen: a master regulator of bioenergetic systems in the brain and body. Front Neuroendocrinol 2014;35:8-30.ArticlePubMed
- 45. Basu A, Dube S, Basu R. Men are from Mars, women are from Venus: sex differences in insulin action and secretion. Adv Exp Med Biol 2017;1043:53-64.ArticlePubMed
 PubReader
 ePub Link
 Cite
Cite


