
- Current
- Browse
- Collections
-
For contributors
- For Authors
- Instructions to authors
- Article processing charge
- e-submission
- For Reviewers
- Instructions for reviewers
- How to become a reviewer
- Best reviewers
- For Readers
- Readership
- Subscription
- Permission guidelines
- About
- Editorial policy
Articles
- Page Path
- HOME > Diabetes Metab J > Ahead-of print > Article
-
Original ArticleMetabolic Risk/Epidemiology Glycemic Control Is Associated with Histological Findings of Nonalcoholic Fatty Liver Disease
-
Teruki Miyake1
 , Shinya Furukawa2, Bunzo Matsuura3, Osamu Yoshida1, Masumi Miyazaki1, Akihito Shiomi1, Ayumi Kanamoto1, Hironobu Nakaguchi3, Yoshiko Nakamura1, Yusuke Imai1, Mitsuhito Koizumi1, Takao Watanabe1, Yasunori Yamamoto1, Yohei Koizumi1, Yoshio Tokumoto1, Masashi Hirooka1, Teru Kumagi4, Eiji Takesita1, Yoshio Ikeda1, Masanori Abe1, Yoichi Hiasa1
 -
DOI: https://doi.org/10.4093/dmj.2023.0200
Published online: February 2, 2024
- 992 Views
- 42 Download
- 1 Crossref
1Department of Gastroenterology and Metabology, Ehime University Graduate School of Medicine, Toon, Japan
2Health Services Center, Ehime University, Matsuyama, Japan
3Department of Lifestyle-related Medicine and Endocrinology, Ehime University Graduate School of Medicine, Toon, Japan
4Postgraduate Medical Education Center, Ehime University Graduate School of Medicine, Toon, Japan
- Corresponding author: Teruki Miyake Department of Gastroenterology and Metabology, Ehime University Graduate School of Medicine, Toon, Ehime 791-0295, Japan E-mail: miyake.teruki.mg@ehime-u.ac.jp
Copyright © 2024 Korean Diabetes Association
This is an Open Access article distributed under the terms of the Creative Commons Attribution Non-Commercial License (http://creativecommons.org/licenses/by-nc/4.0/) which permits unrestricted non-commercial use, distribution, and reproduction in any medium, provided the original work is properly cited.
ABSTRACT
-
Background
- Poor lifestyle habits may worsen nonalcoholic fatty liver disease (NAFLD), with progression to nonalcoholic steatohepatitis (NASH) and cirrhosis. This study investigated the association between glycemic control status and hepatic histological findings to elucidate the effect of glycemic control on NAFLD.
-
Methods
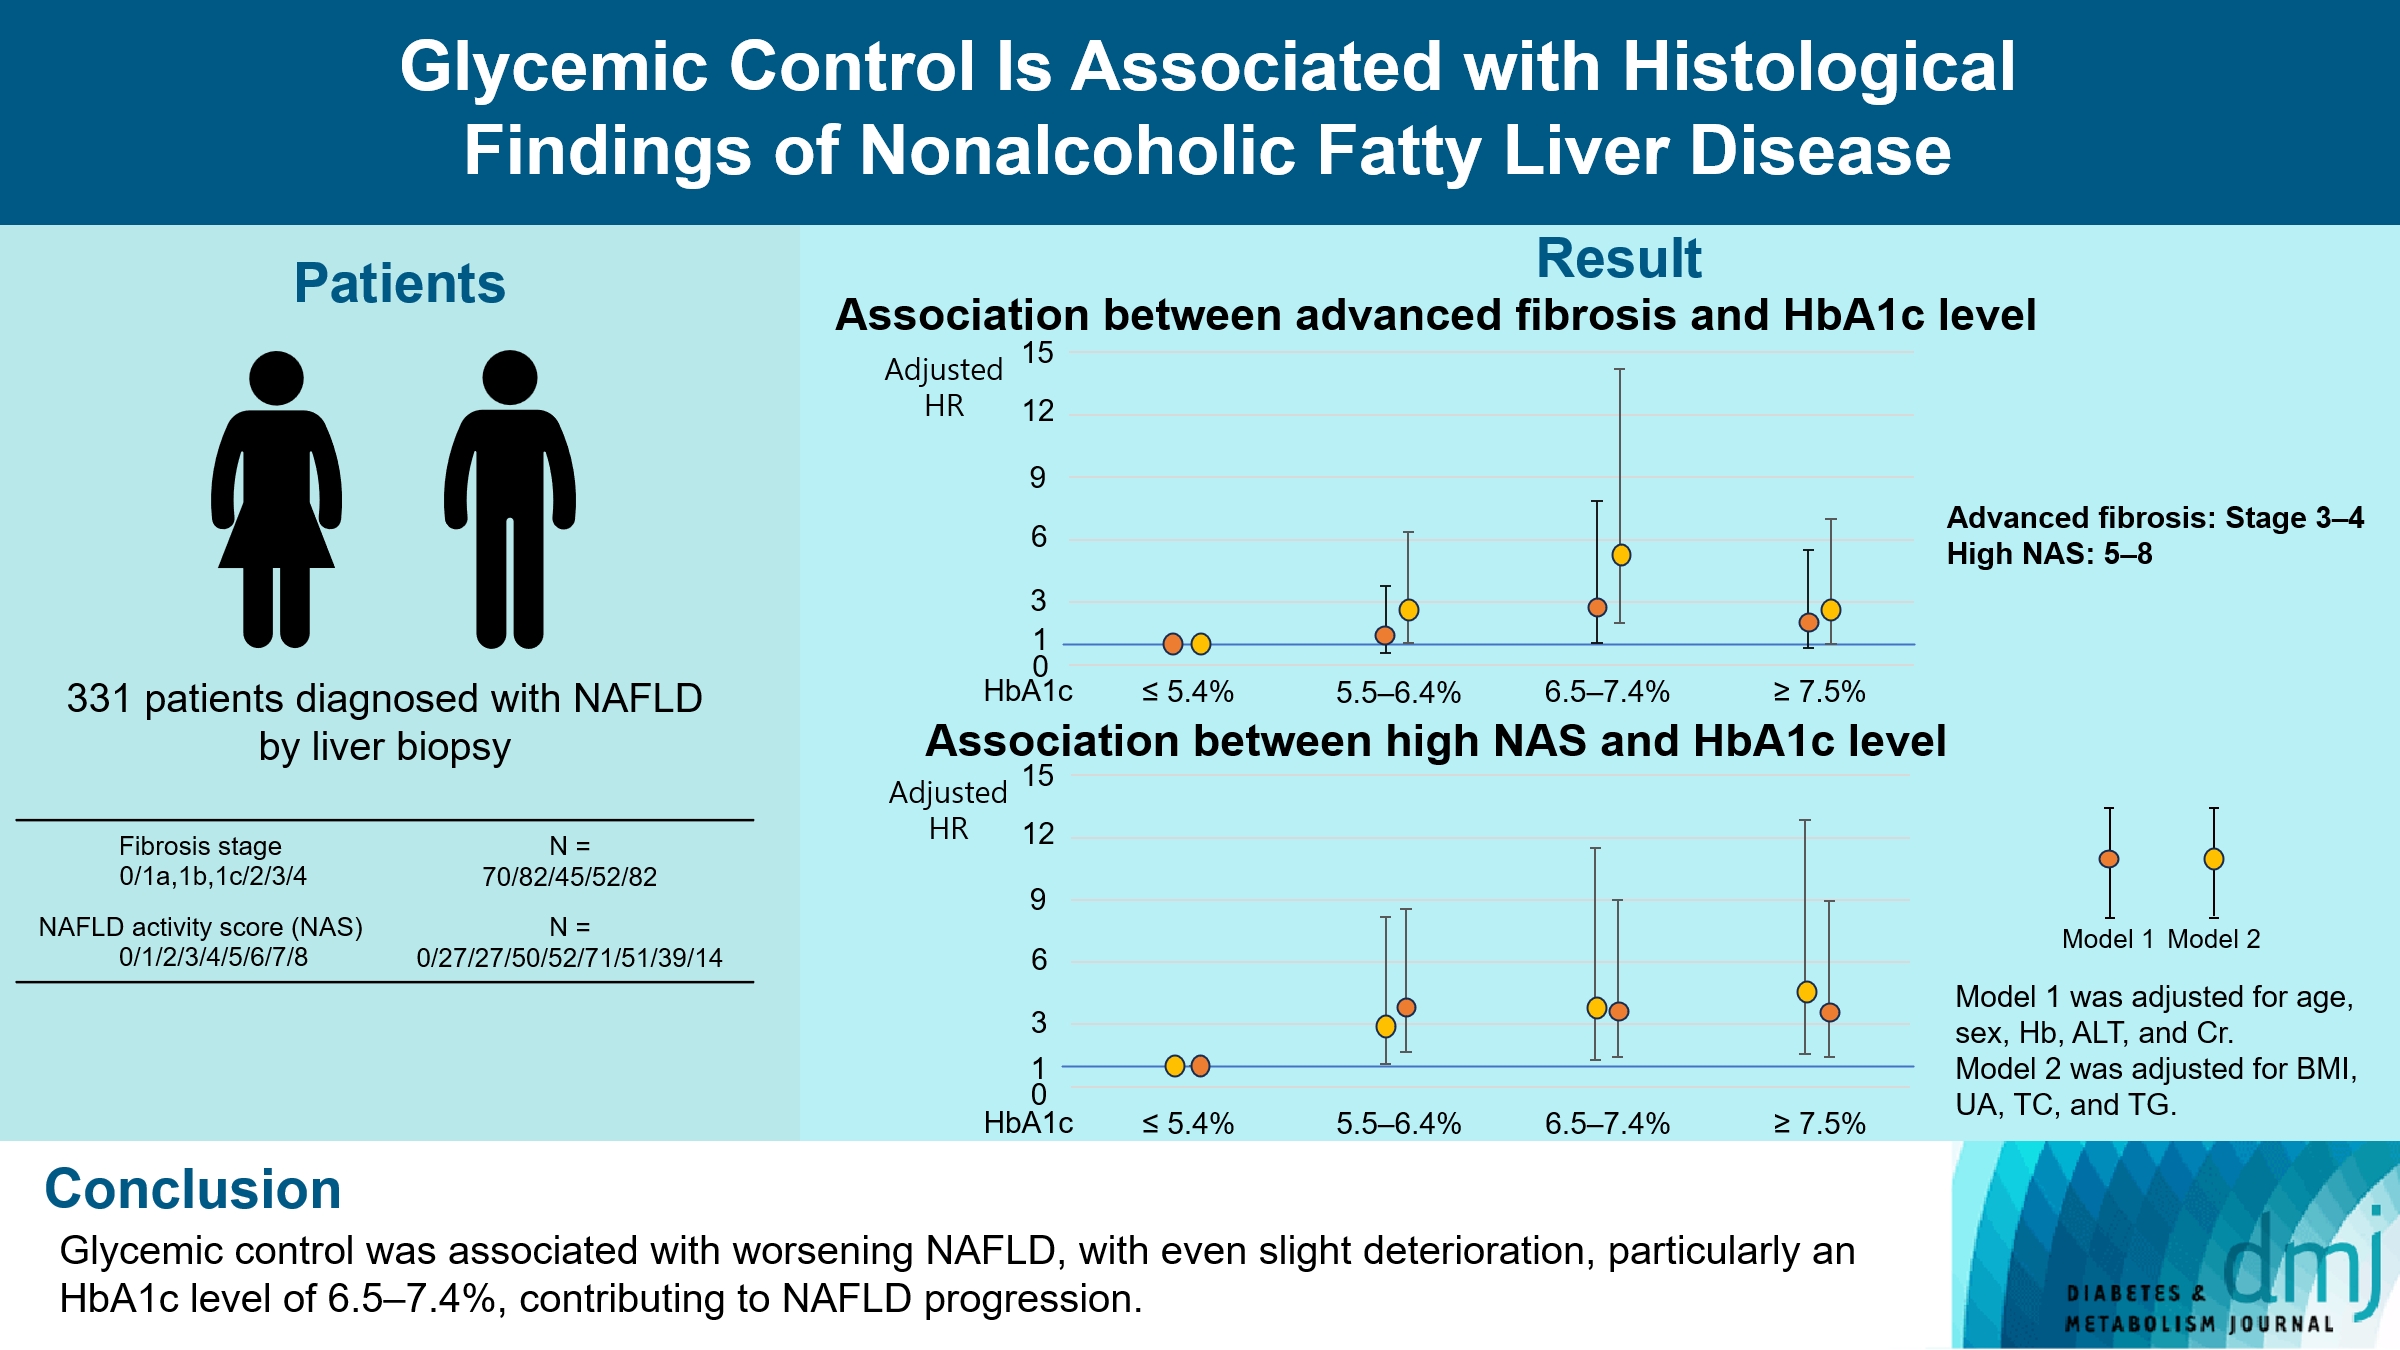
- This observational study included 331 patients diagnosed with NAFLD by liver biopsy. Effects of the glycemic control status on histological findings of NAFLD were evaluated by comparing the following four glycemic status groups defined by the glycosylated hemoglobin (HbA1c) level at the time of NAFLD diagnosis: ≤5.4%, 5.5%–6.4%, 6.5%–7.4%, and ≥7.5%.
-
Results
- Compared with the lowest HbA1c group (≤5.4%), the higher HbA1c groups (5.5%–6.4%, 6.5%–7.4%, and ≥7.5%) were associated with advanced liver fibrosis and high NAFLD activity score (NAS). On multivariate analysis, an HbA1c level of 6.5%– 7.4% group was significantly associated with advanced fibrosis compared with the lowest HbA1c group after adjusting for age, sex, hemoglobin, alanine aminotransferase, and creatinine levels. When further controlling for body mass index and uric acid, total cholesterol, and triglyceride levels, the higher HbA1c groups were significantly associated with advanced fibrosis compared with the lowest HbA1c group. On the other hand, compared with the lowest HbA1c group, the higher HbA1c groups were also associated with a high NAS in both multivariate analyses.
-
Conclusion
- Glycemic control is associated with NAFLD exacerbation, with even a mild deterioration in glycemic control, especially a HbA1c level of 6.5%–7.4%, contributing to NAFLD progression.
Highlights
- The combination of a high-calorie diet and low physical activity, often the result of increased use of technology, has increased the incidence of various diseases, particularly lifestyle-related diseases. Nonalcoholic fatty liver disease (NAFLD) is one of the most common liver diseases that is increasingly associated with low life expectancy [1-6]. Although appropriate lifestyle interventions, such as nutritional and exercise therapy, can improve the pathophysiology of nonalcoholic fatty liver (NAFL), poor lifestyle habits may worsen NAFL, with progression to nonalcoholic steatohepatitis (NASH) and cirrhosis [1-4]. Additionally, as advanced NASH is a risk factor for hepatocellular carcinoma, liver failure, and cardiovascular diseases, knowledge of its characteristics is important for patient management and treatment [4-8].
- Both the presence of diabetes mellitus (DM) and its poor control status are risk factors for the development and progression of diabetic retinopathy, nephropathy, neuropathy, and cardiovascular diseases [9-12]. The presence of DM is a risk factor for the development and progression of NAFLD [13-16]. The influence of fluctuations in the blood glucose level on liver histology in NAFLD has been shown using serial biopsies [17]. However, studies examining the association between the control status of DM and the concurrent histological activity of NAFLD have been limited [18]. Accordingly, in this study, we examined liver specimens and glycosylated hemoglobin (HbA1c) levels at the time of liver biopsy to elucidate the association between glycemic control status and hepatic histological findings in NAFLD.
INTRODUCTION
- Statement of ethics
- Our study protocol followed the ethical guidelines of the 1995 Declaration of Helsinki, revised in 2013, and was approved by the Ethics Committee of Ehime University Hospital (Approval ID# 1012004, 1709008). The requirement for informed consent was waived because the study used data from routine medical practice at Ehime University Hospital. Patient data were anonymized for analysis.
- Study design and patient study sample
- This was an observational study of 349 Japanese patients (143 men and 206 women), 18 to 80 years of age, with NAFLD confirmed by liver biopsy at our hospital between January 2005 and May 2021 after an examination indicating elevated levels of liver enzymes or imaging (ultrasonography or computed tomography) findings indicative of possible liver injury. The inclusion criteria were as follows: lipid droplets in >5% of liver hepatocytes; absence of liver diseases of other etiologies, including viral hepatitis, autoimmune hepatitis, drug-induced liver disease, primary biliary cirrhosis, primary sclerosing cholangitis, hemochromatosis, and Wilson’s disease; history of no or little alcohol consumption (men, ≤30 g/day; women, ≤20 g/day); and absence of decompensated liver cirrhosis and hepatocellular carcinoma. Among the 349 patients, 18 were excluded for the following reasons: missing data (n=2); presence of other cancers (n=4); use of steroids (n=10); and patients determined inappropriate for the study because fatty liver may be caused by reasons other than metabolic disorder (n=2). After selection, 331 patients (140 men and 191 women) were included in the analysis.
- Measurements and evaluations
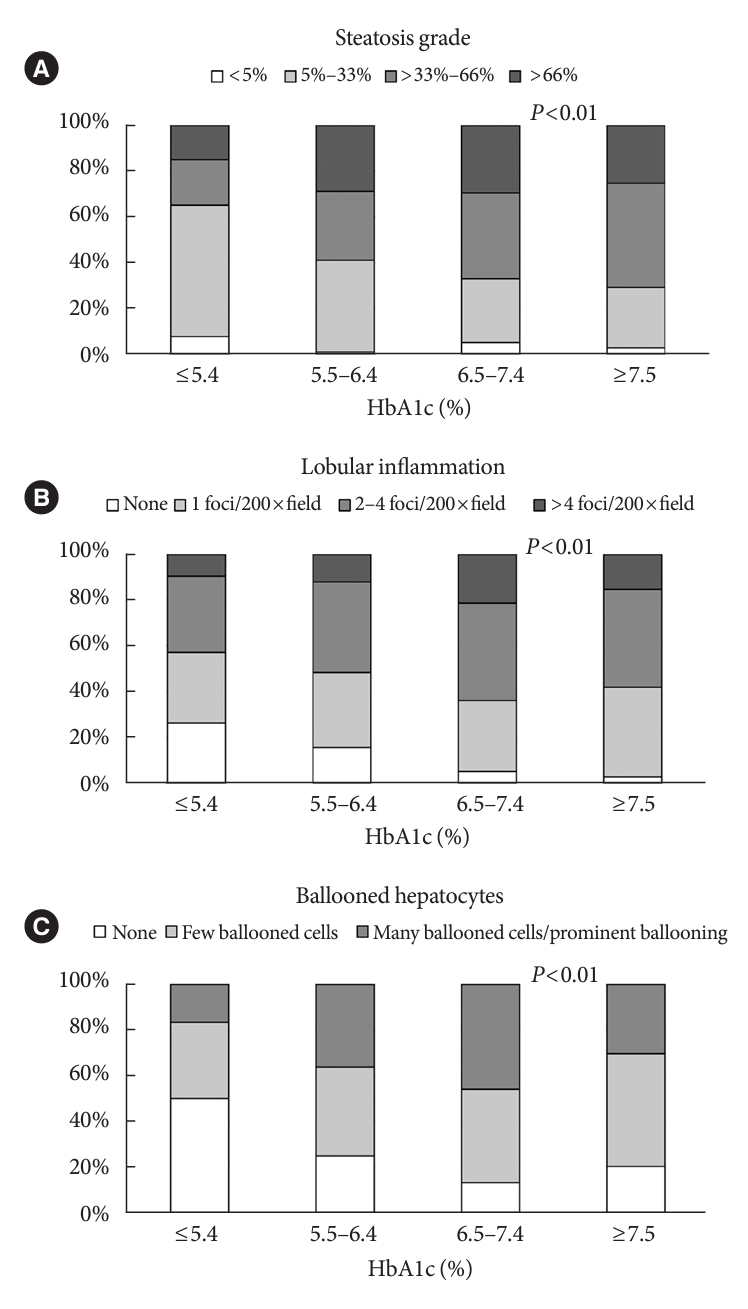
- The following patient data were assessed: medical history, prescribed medication history, physical examination, biochemical measurements, and histological liver examination. Body weight and height were measured with patients in light clothing and shoes to calculate the body mass index (BMI, kg/m2). Venous blood samples were collected in the morning, after a 12-hour overnight fast, to assess blood count and blood chemistry. The levels of the following blood parameters were evaluated: hemoglobin, alanine aminotransferase (ALT), uric acid (UA), creatinine, total cholesterol (TC), triglyceride (TG), and HbA1c. Insulin and fasting plasma glucose (FPG) levels in patients who were not on insulin therapy were used to calculate the homeostasis model assessment of insulin resistance (HOMA-IR), as follows: HOMA-IR=FPG (mg/dL)×insulin (μU/mL)/405. Liver tissues were obtained by percutaneous liver biopsy guided by ultrasonography or laparoscopy. Liver samples were embedded in paraffin and stained with hematoxylin, eosin, and reticulin silver. Adequate liver samples were defined as those that were 1.5 cm in size and/or those including tissue from at least six portal tracts. The histological findings of the liver specimens were evaluated according to the NAFLD activity score (NAS) and severity of hepatic fibrosis (stage), as previously described [19,20], by two hepatopathologists (O.Y., T.W.) who were blinded to patients’ clinical data. The unweighted NAS score ranged from “0” to “8,” and was defined as follows: steatosis, 0–3; lobular inflammation, 0–3; and ballooning degeneration, 0–2. The fibrosis stage was defined as previously described [19,20]: stage 0, absence of fibrosis; stage 1a, delicate perisinusoidal fibrosis; stage 1b, dense perisinusoidal fibrosis; stage 1c, portal-only fibrosis without perisinusoidal fibrosis; stage 2, combined perisinusoidal and portal/periportal fibrosis; stage 3, bridging fibrosis; and stage 4, cirrhosis. Advanced fibrosis and high NAS were defined as stages 3–4 and 5–8, respectively [21,22].
- Statistical analyses
- Data are presented as the median (interquartile range) or number (percentage) for continuous and categorical variables, respectively. Patients were classified into four groups for analysis, using the HbA1c level at the time of NAFLD diagnosis, in 1% intervals based on an HbA1c level of 6.5%, which is used as a diagnostic criterion for DM [23], making the classification more clinically applicable: group 1, HbA1c ≤5.4%; group 2, HbA1c 5.5%–6.4%; group 3, HbA1c 6.5%–7.4%; and group 4, HbA1c ≥7.5%. To evaluate between-group differences, the Mann-Whitney U test, unpaired t-test, Steel-Dwass test, or Tukey-Kramer test was used for continuous data, and the chi-square test was used for categorical data. Two multiple logistic regression models were used to evaluate the effect of glycemic control on NAFLD, controlling for potential confounding factors identified a priori from the literature: model 1 was adjusted for age, sex, and hemoglobin, ALT, and creatinine levels, and model 2 was adjusted for BMI and UA, TC, and TG levels. Statistical analyses were performed using JMP version 14.2.0 (SAS Institute, Cary, NC, USA). Statistical significance was set at a P<0.05.
METHODS
- Patient characteristics
- Patient characteristics according to HbA1c levels at the time of NAFLD diagnosis are shown in Table 1. The following significant between-group differences were observed: greater age and BMI in the higher HbA1c groups compared with the lowest group (≤5.4%); a lower UA level in the highest HbA1c group compared with the 5.5%–6.4% group; a higher proportion of patients with advanced fibrosis in the HbA1c 6.5%–7.4% group than in the other groups; and a higher proportion of patients with a high NAS in the higher HbA1c groups compared with the lowest HbA1c group (≤5.4%). Additionally, compared with the fibrosis stage 0–2 group, the fibrosis stage 3–4 group had a lower male-to-female ratio and a higher proportion of patients with DM, as well as patients who were older, had higher BMI and HbA1c levels, and lower hemoglobin, UA, and TC levels (Supplementary Table 1). In addition, compared with the NAS 1–4 group, patients in the NAS 5–8 group had a higher BMI, as well as higher ALT, UA, TG, and HbA1c levels (Supplementary Table 1).
- Association between components of the NAS and HbA1c
- Compared with patients in the HbA1c <5.4% group, patients in the other three HbA1c groups had higher steatosis grades, stronger lobular inflammation, and more ballooned hepatocytes (Fig. 1). In particular, the HbA1c 6.5%–7.4% group had a higher proportion of patients with a >66% steatosis grade, >4 foci/200×field inflammation, and many cells/prominent ballooning compared with the other groups (Fig. 1).
- Association between advanced fibrosis and HbA1c level
- Univariate analysis revealed a significant association between the HbA1c 5.5%–6.4%, HbA1c 6.5%–7.4%, and HbA1c ≥7.5% groups and advanced fibrosis compared with the lowest HbA1c group (Table 2). Multivariate analysis adjusted for age, sex, hemoglobin, ALT, and creatinine levels (Model 1) revealed a significant association between the HbA1c 6.5%–7.4% group and advanced fibrosis compared with the lowest HbA1c group (Table 2). Model 2, adjusted for BMI, UA, TC, and TG levels, revealed a significant association between the HbA1c 5.5%–6.4%, HbA1c 6.5%–7.4%, and HbA1c ≥7.5% groups and advanced fibrosis compared with the lowest HbA1c group (Table 2). Additionally, after excluding patients using pioglitazone, glucagonlike peptide-1 receptor agonists, and sodium-glucose transport protein 2 inhibitors, associations identified on univariate and multivariate analyses remained (Supplementary Table 2).
- Association between high NAS and HbA1c level
- In the univariate analysis, the HbA1c 5.5%–6.4%, HbA1c 6.5%–7.4%, and HbA1c ≥7.5% groups were significantly associated with a high NAS compared with the lowest HbA1c group (Table 3). These associations remained significant in the multivariate analysis using models 1 and 2 (Table 3). Additionally, after excluding patients using pioglitazone, glucagon-like peptide-1 receptor agonists, and sodium-glucose transport protein 2 inhibitors, these significant associations were preserved in the univariate and multivariate analyses (Supplementary Table 3).
- Association between histological findings and fasting insulin concentration (HOMA-IR)
- In patients who were not on insulin therapy and for whom measurements of insulin and FPG levels were available, the insulin and HOMA-IR levels were higher in the fibrosis stage 3–4 and NAS 5–8 groups compared with those in the fibrosis stage 0–2 and NAS 0–4 groups, respectively (Table 4).
RESULTS
- In this study, we examined the association between HbA1c levels at the time of NAFLD diagnosis and hepatic histological findings. Our results revealed that even slightly elevated HbA1c levels were associated with advanced fibrosis and high NAS. The association between high NAS in the HbA1c 5.5%–6.4%, 6.5%–7.4%, and ≥7.5% groups and advanced NASH in the HbA1c 6.5%–7.4% group remained significant even after adjusting for potential confounders. Therefore, patients with NAFLD who have mildly high glucose levels may have high NAFLD activity and, thus, may require more aggressive therapeutic interventions to prevent disease progression.
- Several reports have shown a relationship between diabetes and NAFLD. In their cross-sectional study of 1,365 patients with NAFLD diagnosed by liver biopsy, Nakahara et al. [14] reported that in both men and women with NAFLD, the proportion of patients with DM increased as the fibrosis stage progressed, with DM identified as a risk factor for advanced fibrosis. Angulo et al. [15] conducted a retrospective cohort study of 619 patients with NAFLD diagnosed by liver biopsies to examine the histologic features of the liver associated with long-term prognosis. Their findings indicated that DM and fibrosis stages were significantly associated with mortality and liver transplant events. Additionally, in their examination of 39 patients with NAFLD who underwent serial liver biopsies over a median follow-up of 2.4 years (range, 1.0 to 8.5), Hamaguchi et al. [17] reported the effects of metabolic abnormalities on the histological changes of NAFLD, identifying changes in HbA1c level as a predictor of liver fibrosis progression. In their examination of histological findings in 98 patients with NAFLD, Leite et al. [24] found that NASH was highly prevalent among patients with NAFLD complicated by type 2 DM (78.3% of the sample). However, compared with patients with NAFL, there were no significant differences in DM duration, medications, microvascular and macrovascular complications, FPG levels, or glycated hemoglobin levels among patients with NASH. Additionally, there was no significant difference in these measures between patients with NAFLD with moderate-to-severe fibrosis and those without fibrosis. Although these studies revealed the effect of DM in patients with NAFLD, they did not examine the relationship between the glycemic control status and histological findings of NAFLD, which was the aim of our study.
- Alexopoulos et al. [18] examined the association between the mean HbA1c level over the 1-year period that preceded liver biopsy and the histological findings of 713 biopsy-proven cases of NAFLD. Their generalized linear regression models, adjusted for confounding factors, showed that a higher mean HbA1c level was associated with an increase in fibrosis stage, a higher grade of steatosis, and more ballooned hepatocytes, but not with lobular inflammation. Additionally, a group-based trajectory analysis that included 298 patients with at least three HbA1c measurements over the 5 years before liver biopsy showed that moderate glycemic control (median HbA1c level, 7.6%) was associated with increased severity of ballooned hepatocytes and hepatic fibrosis when compared with good glycemic control (median HbA1c level, 6.0%); the poor control group (median HbA1c level, 10.0%) could not be analyzed due to a small sample size [18]. However, the study did not investigate the clinically important pathogenesis of fibrosis stage 4, most likely because the proportion of patients with stage 4 fibrosis in their study sample was only approximately 5%. In addition, the results of that study might differ from those in Asian populations as Asian patients with diabetes have a low insulin secretory capacity [25]. Our findings indicated that even mildly elevated HbA1c levels were associated with high NAS, with the HbA1c 6.5%–7.4% group being associated with advanced liver fibrosis. Our results can, therefore, inform clinicians regarding the high risk of NAFLD progression in patients with increased HbA1c levels.
- In contrast to previous studies, we identified a stronger association between high NAS and HbA1c levels than between advanced fibrosis and HbA1c levels. The NAS may reflect the condition of NAFLD to a greater extent at the time of diagnosis based on liver biopsy than at the fibrosis stage. The pathogenesis of NAFLD involves insulin resistance, inflammation, oxidative stress, and endoplasmic reticulum stress [26-29]. The liver fibrosis status may reflect the effect of these pathological conditions over a longer period than the NAS. Therefore, it is possible that the NAS is more strongly affected by a patient’s current glycemic status. Additionally, the strong association between NAS and mildly poor glycemic control status may be related to insulin secretion [26]. Since insulin enhances fat synthesis, the pathophysiological progression of NAFLD may be greater in the presence of mildly elevated HbA1c levels, which increase insulin secretion, compared with a poorly controlled glycemic state [30]. Additionally, although patients with decompensated cirrhosis were excluded from this study, HbA1c levels in patients with advanced fibrosis may be generally underestimated due to increased glucose variability [31]. Therefore, the association between advanced fibrosis and poor glycemic control may not be significant.
- The limitations of our study need to be acknowledged. First, glycemic control was evaluated only by measuring the HbA1c level. In patients with advanced NASH, anemia, or chronic kidney disease, glycemic control status may be underestimated when assessed only using the HbA1c level. However, as for chronic kidney disease, no individual in our study, male or female, had an epidermal growth factor receptor (eGFR) <30 mL/min/1.73 m2. One female and one male individual had an eGFR of 30 to 40 mL/min/1.73 m2, while the rest had an eGFR >40 mL/min/1.73 m2. Regarding the hemoglobin level, one male individual had an hemoglobin level of 100 to 110 g/L and one had a level of 110 to 120 g/L, with all other individuals having hemoglobin levels >120 g/L. One female individual had an hemoglobin level of 90 to 100 g/L, and four had a level of 100 to 110 g/L, with all others having an hemoglobin level >110 g/L. Therefore, these may have had little influence on the results. Second, the glycemic control status was evaluated only at the time of the NAFLD diagnosis. Although the long-term blood glucose control status may not be accurately reflected, these results could be helpful for outpatient care personnel to identify cases of NASH requiring attention. Third, based on HbA1c 6.5%, we chose to use a delimitation of 1%, which we believed to be a more easily understood reference value in clinical practice. In this regard, we used the cutoff of HbA1c 5.4% for the lowest group but not 5.6%, which was the cutoff for normoglycemia. However, the rate of advanced fibrosis or high NAS was higher in the HbA1c 5.5%–5.6% group than in the HbA1c ≤5.4% group and closer to that in the 5.7%–6.4% group (HbA1c: 5.4% group, 5.5%–5.6% group, 5.7%–6.4% group; advanced fibrosis: 19.1%, 40.6%, 36.8%; high NAS: 23.8%, 59.4%, 55.6%, respectively). Additionally, BMI and HOMA-IR, two of the factors most strongly associated with NAFLD, were significantly higher in the HbA1c 5.5%–6.4% group compared with the HbA1c ≤5.4% group [32-34]. Therefore, we determined that HbA1c ≤5.4% was the appropriate reference range for the stratification of advanced fibrosis and high NAS. On the other hand, patients with DM were included in the HbA1c ≤5.4% and 5.5%–6.4% groups. We acknowledge that the risk of NAFLD among these patients may have differed from that of patients without DM; however, the number of individuals with DM in the HbA1c ≤5.4% and 5.5%–6.4% groups was small, and therefore, a separate analysis for patients with and without DM in these HbA1c groups could not be performed. Fourth, the impact of drug therapy, such as diabetes medication, may not have been adequately considered. However, in multivariate analysis with the addition of biguanide use, which was used in 59 (18%) cases, there was little effect on the association between glycemic control status and hepatic histological findings. Thus, the influence of anti-diabetes drug treatment on the results of this study is likely limited. Finally, our study used a cross-sectional design; therefore, the causal relationship between HbA1c level and NAFLD is not known. Therefore, a future study is needed to elucidate the causal relationship.
- Despite these limitations, our study revealed an important dimension in the follow-up of patients with NAFLD, who often present in outpatient clinics for diabetes. The complications of DM in patients with NASH are implicated in the pathogenesis of both worsening NAFLD activity and fibrosis progression. In addition, the glycemic control status is associated with exacerbation of the NAS and fibrosis stage, and even a mild deterioration in glycemic control, especially an HbA1c level of 6.5%–7.4%, might contribute to the progression of not only cardiovascular diseases [35] but also NAFLD. Therefore, to prevent NAFLD progression, attention should be paid to patients with NAFLD and mildly poor glycemic control. Additionally, as improving NAS is considered the first step in treating NASH, adequate glycemic control may be important to consider in improving NASH activity and preventing fibrosis progression.
DISCUSSION
SUPPLEMENTARY MATERIALS
Supplementary Table 1.
Supplementary Table 2.
Supplementary Table 3.
-
CONFLICTS OF INTEREST
No potential conflict of interest relevant to this article was reported.
-
AUTHOR CONTRIBUTIONS
Conception or design: T.M., S.F., B.M., Y.H.
Acquisition, analysis, or interpretation of data: T.M., S.F., O.Y., M.M., A.S., A.K., H.N., Y.N., Y.I., M.K., T.W., Y.Y., Y.K., Y.T., M.H., T.K., E.T., Y.I., M.A., Y.H.
Drafting the work or revising: T.M.
Final approval of the manuscript: all authors.
-
FUNDING
This research was funded by Japan Society for the Promotion of Science Kakenhi (JSPS KAKENHI), Grant Number 22K11804. The funders had no role in study design, data collection and analysis, decision to publish, or preparation of the manuscript.
NOTES
-
Acknowledgements
- None
| Characteristic | Total (n=331) |
HbA1c (group) |
P value |
||||||||
|---|---|---|---|---|---|---|---|---|---|---|---|
| ≤5.4% (n=42) (group A) | 5.5%–6.4% (n=149) (group B) | 6.5%–7.4% (n=61) (group C) | ≥7.5% (n=79) (group D) | A vs. B | A vs. C | A vs. D | B vs. C | B vs. D | C vs. D | ||
| Age, yr | 59 (46–67) | 40 (30.8–56.5) | 60 (46–68) | 63 (53–68.5) | 58 (49–65) | <0.01 | < 0.01 | < 0.01 | 0.35 | 0.92 | 0.12 |
| Male sex, % | 42.3 | 59.5 | 40.3 | 39.3 | 39.2 | 0.12b | |||||
| BMI, kg/m2 | 27.1 (24.0–30.2) | 24.3 (22.1–27.0) | 26.8 (23.7–29.7) | 27.1 (25.1–31.6) | 29.0 (25.9–31.1) | <0.01 | < 0.01 | < 0.01 | 0.53 | < 0.01 | 0.52 |
| Hemoglobin, g/L | 144 (133–152) | 147 (131–155) | 143 (134–152) | 143 (134–152) | 141 (131–155) | 0.94 | 0.94 | 0.96 | 1.00 | 1.00 | 1.00 |
| ALT, IU/L | 61 (37–102) | 57 (31–72.8) | 70 (37.5–115) | 52 (41–96.5) | 61 (34–102) | 0.19 | 0.92 | 0.80 | 0.67 | 0.53 | 1.00 |
| UA, µmol/L | 351 (292–405) | 363 (320–418) | 357 (303–416) | 345 (309–402) | 315 (268–387) | 0.98 | 0.79 | 0.12 | 0.90 | 0.02 | 0.22 |
| Creatinine, µmol/L | 60.1 (51.3–70.7) | 62.3 (51.9–73.2) | 60.1 (53.0–74.7) | 57.5 (51.7–68.5) | 57.5 (48.6–69.0) | 0.99 | 0.58 | 0.37 | 0.59 | 0.28 | 0.93 |
| TC, mmol/L | 5.02 (4.37–5.69) | 4.94 (4.27–5.65) | 5.09 (4.54–5.79) | 4.91 (4.22–5.60) | 4.86 (4.40–5.66) | 0.97a | 0.97a | 0.98a | 0.69a | 0.73a | 1.00a |
| TG, mmol/L | 1.43 (1.06–1.95) | 1.35 (0.80–1.94) | 1.38 (1.02–1.84) | 1.51 (1.09–1.99) | 1.47 (1.11–2.17) | 0.83 | 0.35 | 0.13 | 0.57 | 0.15 | 0.96 |
| DM, % | 52.3 | 7.1 | 20.1 | 100 | 100 | <0.01b | |||||
| Duration of diabetes, yrc | 4 (1–10) | 3 (0–9) | 3.5 (0.9–9.3) | 3 (1–6) | 7 (2–15) | 0.99 | 1.00 | 0.73 | 0.99 | 0.17 | <0.01 |
| Fibrosis stage (3–4), % | 40.5 | 19.1 | 37.6 | 57.4 | 44.3 | <0.01b | |||||
| NAS (5–8), % | 52.9 | 23.8 | 56.4 | 57.4 | 58.2 | <0.01b | |||||
| Anti-diabetes agents | |||||||||||
| Biguanide, % | 17.8 | 2.4 | 5.4 | 29.5 | 40.5 | <0.01b | |||||
| DPP4i, % | 11.5 | 2.4 | 3.4 | 21.3 | 24.1 | <0.01b | |||||
| Sulfonylurea, % | 10.3 | 0 | 0.7 | 8.2 | 35.4 | <0.01b | |||||
| AGI, % | 3.9 | 0 | 0.7 | 4.9 | 11.4 | <0.01b | |||||
| Pioglitazone, % | 3.3 | 0 | 1.3 | 1.6 | 10.1 | 0.14b | |||||
| Glinide, % | 1.5 | 0 | 1.3 | 1.6 | 2.5 | 0.03b | |||||
| GLP-1RA, % | 2.1 | 2.4 | 2.0 | 1.6 | 2.5 | 0.98b | |||||
| SGLT2i, % | 2.4 | 0 | 2.7 | 1.6 | 3.8 | 0.60b | |||||
| Insulin, % | 7.3 | 0 | 2.0 | 1.6 | 25.3 | <0.01b | |||||
Values are presented as median (interquartile range) or percentage.
To evaluate between-group differences, the Steel-Dwass test or
a Tukey’s test was used for continuous variables,
b Chi-square test was used for categorical variables.
P<0.05 was considered significant,
c Duration of diabetes in patients with DM.
HbA1c, glycosylated hemoglobin; NAFLD, nonalcoholic fatty liver disease; BMI, body mass index; ALT, alanine aminotransferase; UA, uric acid; TC, total cholesterol; TG, triglyceride; DM, diabetes mellitus; NAS, activity score; DPP4i, dipeptidyl peptidase-4 inhibitor; AGI, alpha-glucosidase inhibitor; GLP-1RA, glucagon-like peptide-1 receptor agonist; SGLT2i, sodium-glucose transport protein 2 inhibitor.
Differences were considered statistically significant at P<0.05. Model 1 was adjusted for age (years), sex, and hemoglobin (g/L), alanine aminotransferase (IU/L), and creatinine (μmol/L) levels. Model 2 was adjusted for body mass index (kg/m2) and uric acid (μmol/L), total cholesterol (mmol/L), and triglyceride (mmol/L) levels.
HbA1c, glycosylated hemoglobin; OR, odds ratio; CI, confidence interval.
Differences were considered statistically significant at P<0.05. Model 1 was adjusted for age (years), sex, and hemoglobin (g/L), alanine aminotransferase (U/L), and creatinine (μmol/L) levels. Model 2 was adjusted for body mass index (kg/m2) and uric acid (μmol/L), total cholesterol (mmol/L), and triglyceride (mmol/L) levels.
HbA1c, glycosylated hemoglobin; NAS, NAFLD activity score; OR, odds ratio; CI, confidence interval.
- 1. Marchesini G, Bugianesi E, Forlani G, Cerrelli F, Lenzi M, Manini R, et al. Nonalcoholic fatty liver, steatohepatitis, and the metabolic syndrome. Hepatology 2003;37:917-23.ArticlePubMed
- 2. Marchesini G, Brizi M, Bianchi G, Tomassetti S, Bugianesi E, Lenzi M, et al. Nonalcoholic fatty liver disease: a feature of the metabolic syndrome. Diabetes 2001;50:1844-50.PubMed
- 3. Sanyal AJ; American Gastroenterological Association. AGA technical review on nonalcoholic fatty liver disease. Gastroenterology 2002;123:1705-25.ArticlePubMed
- 4. Tokushige K, Ikejima K, Ono M, Eguchi Y, Kamada Y, Itoh Y, et al. Evidence-based clinical practice guidelines for nonalcoholic fatty liver disease/nonalcoholic steatohepatitis 2020. Hepatol Res 2021;51:1013-25.ArticlePubMedPDF
- 5. Yoshioka Y, Hashimoto E, Yatsuji S, Kaneda H, Taniai M, Tokushige K, et al. Nonalcoholic steatohepatitis: cirrhosis, hepatocellular carcinoma, and burnt-out NASH. J Gastroenterol 2004;39:1215-8.ArticlePubMedPDF
- 6. Shimada M, Hashimoto E, Taniai M, Hasegawa K, Okuda H, Hayashi N, et al. Hepatocellular carcinoma in patients with non-alcoholic steatohepatitis. J Hepatol 2002;37:154-60.ArticlePubMed
- 7. Mahfood Haddad T, Hamdeh S, Kanmanthareddy A, Alla VM. Nonalcoholic fatty liver disease and the risk of clinical cardiovascular events: a systematic review and meta-analysis. Diabetes Metab Syndr 2017;11 Suppl 1:S209-16.PubMed
- 8. Ekstedt M, Hagstrom H, Nasr P, Fredrikson M, Stal P, Kechagias S, et al. Fibrosis stage is the strongest predictor for disease-specific mortality in NAFLD after up to 33 years of follow-up. Hepatology 2015;61:1547-54.ArticlePubMed
- 9. Wild S, Roglic G, Green A, Sicree R, King H. Global prevalence of diabetes: estimates for the year 2000 and projections for 2030. Diabetes Care 2004;27:1047-53.ArticlePubMedPDF
- 10. Partanen J, Niskanen L, Lehtinen J, Mervaala E, Siitonen O, Uusitupa M. Natural history of peripheral neuropathy in patients with non-insulin-dependent diabetes mellitus. N Engl J Med 1995;333:89-94.ArticlePubMed
- 11. Leon BM, Maddox TM. Diabetes and cardiovascular disease: epidemiology, biological mechanisms, treatment recommendations and future research. World J Diabetes 2015;6:1246-58.ArticlePubMedPMC
- 12. Shima T, Uto H, Ueki K, Kohgo Y, Yasui K, Nakamura N, et al. Hepatocellular carcinoma as a leading cause of cancer-related deaths in Japanese type 2 diabetes mellitus patients. J Gastroenterol 2019;54:64-77.ArticlePubMed
- 13. McPherson S, Hardy T, Henderson E, Burt AD, Day CP, Anstee QM. Evidence of NAFLD progression from steatosis to fibrosing-steatohepatitis using paired biopsies: implications for prognosis and clinical management. J Hepatol 2015;62:1148-55.ArticlePubMed
- 14. Nakahara T, Hyogo H, Yoneda M, Sumida Y, Eguchi Y, Fujii H, et al. Type 2 diabetes mellitus is associated with the fibrosis severity in patients with nonalcoholic fatty liver disease in a large retrospective cohort of Japanese patients. J Gastroenterol 2014;49:1477-84.ArticlePubMedPDF
- 15. Angulo P, Kleiner DE, Dam-Larsen S, Adams LA, Bjornsson ES, Charatcharoenwitthaya P, et al. Liver fibrosis, but no other histologic features, is associated with long-term outcomes of patients with nonalcoholic fatty liver disease. Gastroenterology 2015;149:389-97.ArticlePubMed
- 16. Tilg H, Moschen AR, Roden M. NAFLD and diabetes mellitus. Nat Rev Gastroenterol Hepatol 2017;14:32-42.ArticlePubMedPDF
- 17. Hamaguchi E, Takamura T, Sakurai M, Mizukoshi E, Zen Y, Takeshita Y, et al. Histological course of nonalcoholic fatty liver disease in Japanese patients: tight glycemic control, rather than weight reduction, ameliorates liver fibrosis. Diabetes Care 2010;33:284-6.PubMed
- 18. Alexopoulos AS, Crowley MJ, Wang Y, Moylan CA, Guy CD, Henao R, et al. Glycemic control predicts severity of hepatocyte ballooning and hepatic fibrosis in nonalcoholic fatty liver disease. Hepatology 2021;74:1220-33.ArticlePubMedPDF
- 19. Kleiner DE, Brunt EM, Van Natta M, Behling C, Contos MJ, Cummings OW, et al. Design and validation of a histological scoring system for nonalcoholic fatty liver disease. Hepatology 2005;41:1313-21.ArticlePubMed
- 20. Farrell GC, McCullough AJ, Day CP. Non-alcoholic fatty liver disease: a practical guide. Hoboken: Wiley-Blackwell; 2013. Chapter 3, Pathology of NAFLD. p. 27-36.
- 21. Konishi K, Miyake T, Furukawa S, Senba H, Kanzaki S, Nakaguchi H, et al. Advanced fibrosis of non-alcoholic steatohepatitis affects the significance of lipoprotein(a) as a cardiovascular risk factor. Atherosclerosis 2020;299:32-37.ArticlePubMed
- 22. Miyake T, Furukawa S, Matsuura B, Yoshida O, Miyazaki M, Shiomi A, et al. Plasma fatty acid composition is associated with histological findings of nonalcoholic steatohepatitis. Biomedicines 2022;10:2540.ArticlePubMedPMC
- 23. American Diabetes Association. 2. Classification and diagnosis of diabetes: standards of medical care in diabetes-2021. Diabetes Care 2021;44(Suppl 1):S15-33.ArticlePubMedPDF
- 24. Leite NC, Villela-Nogueira CA, Pannain VL, Bottino AC, Rezende GF, Cardoso CR, et al. Histopathological stages of nonalcoholic fatty liver disease in type 2 diabetes: prevalences and correlated factors. Liver Int 2011;31:700-6.ArticlePubMed
- 25. Moller JB, Dalla Man C, Overgaard RV, Ingwersen SH, Tornoe CW, Pedersen M, et al. Ethnic differences in insulin sensitivity, β-cell function, and hepatic extraction between Japanese and Caucasians: a minimal model analysis. J Clin Endocrinol Metab 2014;99:4273-80.ArticlePubMed
- 26. Marchesini G, Brizi M, Morselli-Labate AM, Bianchi G, Bugianesi E, McCullough AJ, et al. Association of nonalcoholic fatty liver disease with insulin resistance. Am J Med 1999;107:450-5.ArticlePubMed
- 27. Arrese M, Cabrera D, Kalergis AM, Feldstein AE. Innate immunity and inflammation in NAFLD/NASH. Dig Dis Sci 2016;61:1294-303.ArticlePubMedPMCPDF
- 28. Rolo AP, Teodoro JS, Palmeira CM. Role of oxidative stress in the pathogenesis of nonalcoholic steatohepatitis. Free Radic Biol Med 2012;52:59-69.ArticlePubMed
- 29. Lake AD, Novak P, Hardwick RN, Flores-Keown B, Zhao F, Klimecki WT, et al. The adaptive endoplasmic reticulum stress response to lipotoxicity in progressive human nonalcoholic fatty liver disease. Toxicol Sci 2014;137:26-35.ArticlePubMed
- 30. DeFronzo RA. Lilly lecture 1987. The triumvirate: beta-cell, muscle, liver. A collusion responsible for NIDDM. Diabetes 1988;37:667-87.PubMed
- 31. Addepally NS, George N, Martinez-Macias R, Garcia-Saenz-de-Sicilia M, Kim WR, Duarte-Rojo A. Hemoglobin A1c has suboptimal performance to diagnose and monitor diabetes mellitus in patients with cirrhosis. Dig Dis Sci 2018;63:3498-508.ArticlePubMedPDF
- 32. Miyake T, Kumagi T, Hirooka M, Furukawa S, Koizumi M, Tokumoto Y, et al. Body mass index is the most useful predictive factor for the onset of nonalcoholic fatty liver disease: a community-based retrospective longitudinal cohort study. J Gastroenterol 2013;48:413-22.ArticlePubMedPDF
- 33. Miyake T, Kumagi T, Furukawa S, Tokumoto Y, Hirooka M, Abe M, et al. Non-alcoholic fatty liver disease: factors associated with its presence and onset. J Gastroenterol Hepatol 2013;28 Suppl 4:71-8.ArticlePubMedPDF
- 34. Tilg H, Hotamisligil GS. Nonalcoholic fatty liver disease: cytokine-adipokine interplay and regulation of insulin resistance. Gastroenterology 2006;131:934-45.ArticlePubMed
- 35. Tominaga M, Eguchi H, Manaka H, Igarashi K, Kato T, Sekikawa A. Impaired glucose tolerance is a risk factor for cardiovascular disease, but not impaired fasting glucose. The Funagata Diabetes Study. Diabetes Care 1999;22:920-4.ArticlePubMedPDF
REFERENCES
Figure & Data
References
Citations
- Combined effect of histological findings and diabetes mellitus on liver‐related events in patients with metabolic dysfunction‐associated steatotic liver disease
Akihito Shiomi, Teruki Miyake, Shinya Furukawa, Bunzo Matsuura, Osamu Yoshida, Takao Watanabe, Ayumi Kanamoto, Masumi Miyazaki, Hironobu Nakaguchi, Yoshio Tokumoto, Masashi Hirooka, Masanori Abe, Yoichi Hiasa
Hepatology Research.2024;[Epub] CrossRef
 PubReader
 ePub Link
 Cite
Cite- Figure
-


- Related articles
-
- Comparing the Mortality Risk between Metabolic Dysfunction-Associated Fatty Liver Disease and Non-Alcoholic Fatty Liver Disease
- Lifestyle Interventions for Non-Obese Patients Both with, and at Risk, of Non-Alcoholic Fatty Liver Disease
- Advanced Liver Fibrosis Is Associated with Chronic Kidney Disease in Patients with Type 2 Diabetes Mellitus and Nonalcoholic Fatty Liver Disease


