
- Current
- Browse
- Collections
-
For contributors
- For Authors
- Instructions to authors
- Article processing charge
- e-submission
- For Reviewers
- Instructions for reviewers
- How to become a reviewer
- Best reviewers
- For Readers
- Readership
- Subscription
- Permission guidelines
- About
- Editorial policy
Articles
- Page Path
- HOME > Diabetes Metab J > Volume 47(6); 2023 > Article
-
Original ArticleCardiovascular Risk/Epidemiology Comparison of on-Statin Lipid and Lipoprotein Levels for the Prediction of First Cardiovascular Event in Type 2 Diabetes Mellitus
-
Ji Yoon Kim
 , Jimi Choi, Sin Gon Kim, Nam Hoon Kim
 -
Diabetes & Metabolism Journal 2023;47(6):837-845.
DOI: https://doi.org/10.4093/dmj.2022.0217
Published online: August 23, 2023
- 1,447 Views
- 173 Download
Division of Endocrinology and Metabolism, Department of Internal Medicine, Korea University College of Medicine, Seoul, Korea
-
Corresponding author: Nam Hoon Kim Division of Endocrinology and Metabolism, Department of Internal Medicine, Korea University College of Medicine, 73 Goryeodae-ro, Seongbuk-gu, Seoul 02841, Korea E-mail: pourlife@korea.ac.kr
Copyright © 2023 Korean Diabetes Association
This is an Open Access article distributed under the terms of the Creative Commons Attribution Non-Commercial License (http://creativecommons.org/licenses/by-nc/4.0/) which permits unrestricted non-commercial use, distribution, and reproduction in any medium, provided the original work is properly cited.
ABSTRACT
-
Background
- A substantial cardiovascular disease risk remains even after optimal statin therapy. Comparative predictiveness of major lipid and lipoprotein parameters for cardiovascular events in patients with type 2 diabetes mellitus (T2DM) who are treated with statins is not well documented.
-
Methods
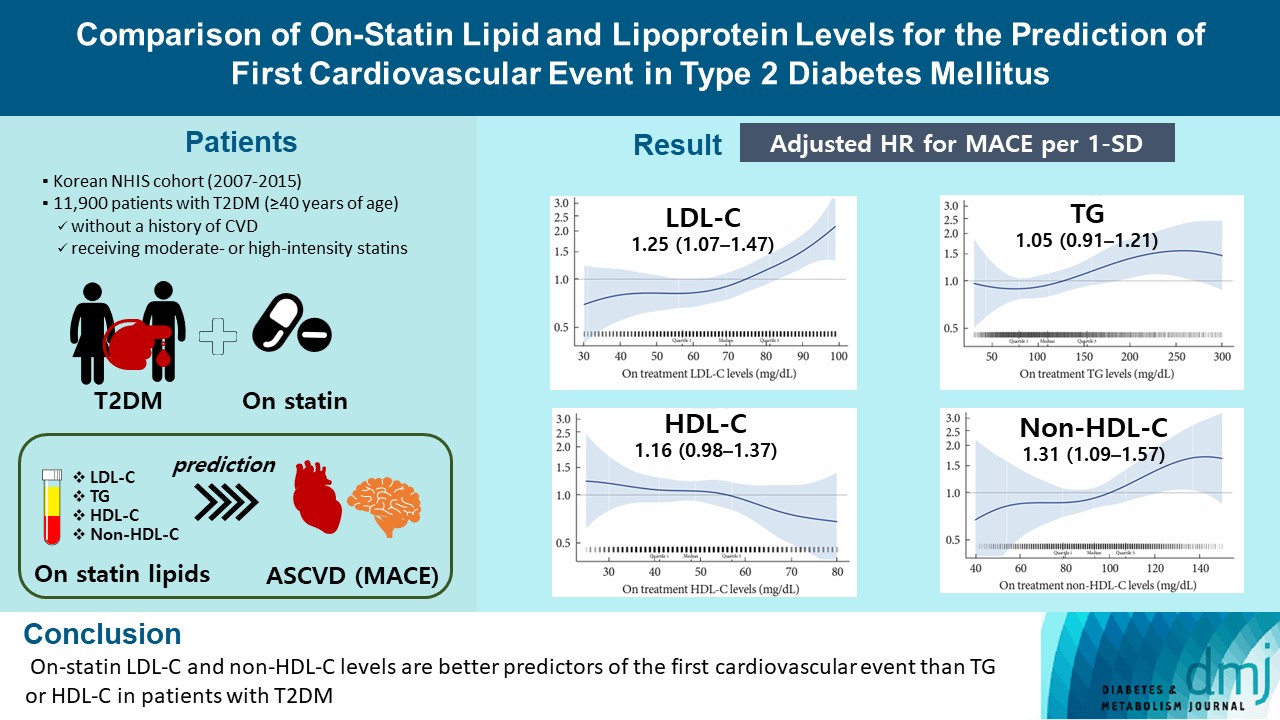
- From the Korean Nationwide Cohort, 11,900 patients with T2DM (≥40 years of age) without a history of cardiovascular disease and receiving moderate- or high-intensity statins were included. The primary outcome was the first occurrence of major adverse cardiovascular events (MACE) including ischemic heart disease, ischemic stroke, and cardiovascular death. The risk of MACE was estimated according to on-statin levels of low-density lipoprotein cholesterol (LDL-C), triglyceride (TG), high-density lipoprotein cholesterol (HDL-C), and non-HDL-C.
-
Results
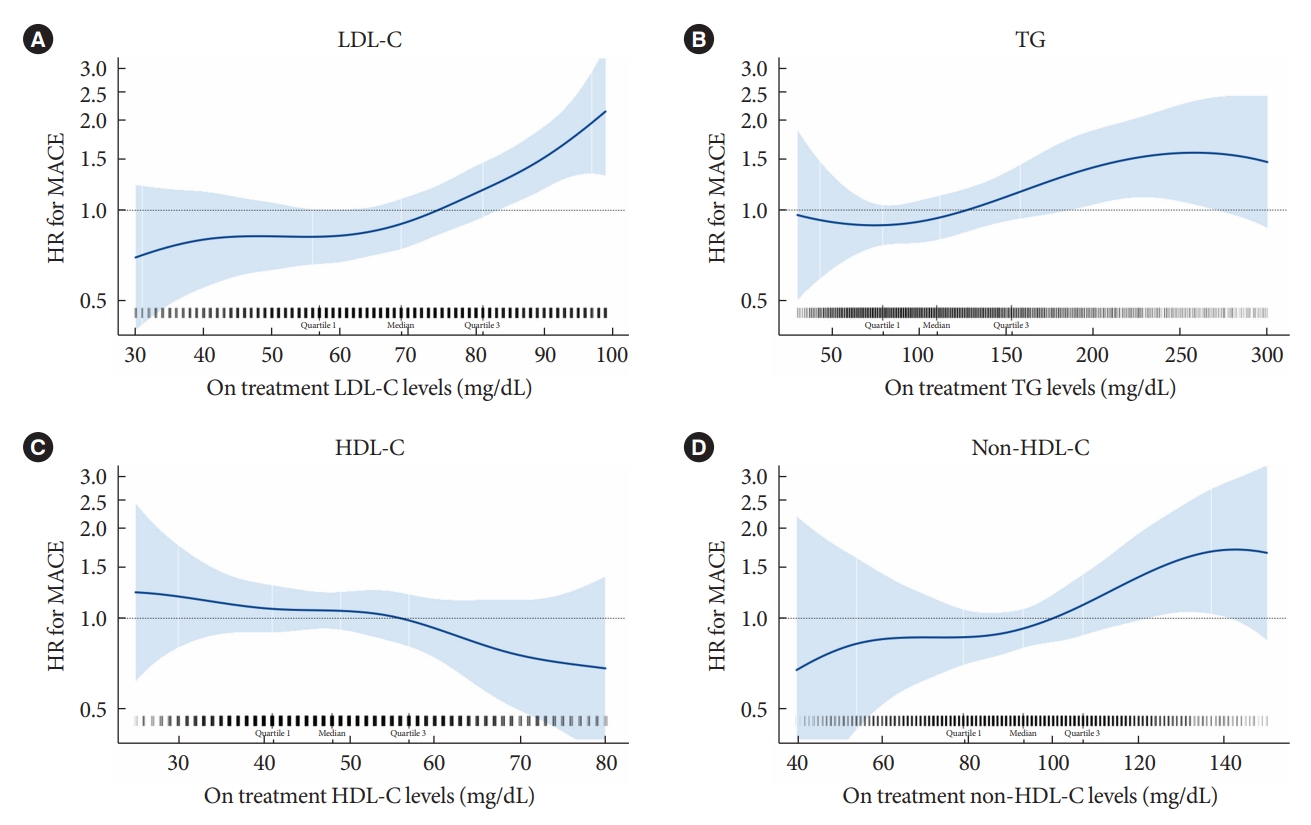
- MACE occurred in 712 patients during a median follow-up period of 37.9 months (interquartile range, 21.7 to 54.9). Among patients achieving LDL-C levels less than 100 mg/dL, the hazard ratios for MACE per 1-standard deviation change in on-treatment values were 1.25 (95% confidence interval [CI], 1.07 to 1.47) for LDL-C, 1.31 (95% CI, 1.09 to 1.57) for non-HDL-C, 1.05 (95% CI, 0.91 to 1.21) for TG, and 1.16 (95% CI, 0.98 to 1.37) for HDL-C, after adjusting for potential confounders and lipid parameters mutually. The predictive ability of on-statin LDL-C and non-HDL-C for MACE was prominent in patients at high cardiovascular risk or those with LDL-C ≥70 mg/dL.
-
Conclusion
- On-statin LDL-C and non-HDL-C levels are better predictors of the first cardiovascular event than TG or HDL-C in patients with T2DM.
- Cardiovascular disease (CVD) is the leading cause of morbidity and mortality in patients with type 2 diabetes mellitus (T2DM). Insulin resistance, the primary pathogenic mechanism underlying T2DM, results in the derangement of lipoprotein metabolism, including elevated triglyceride (TG) levels, an increase in small dense low-density lipoprotein cholesterol (LDL-C) particles, and a decrease in high-density lipoprotein cholesterol (HDL-C) [1]. The management of dyslipidemia with moderate- or high-intensity statins is the mainstay of primary and secondary prevention of CVD in patients with T2DM [2,3]. However, even after the target LDL-C level is achieved with optimal statin therapy, a substantial risk of CVD remains [4,5].
- Several studies have evaluated the role of serum lipid parameters in the prediction of residual cardiovascular risk following statin therapy. Major randomized controlled trials (RCTs) of statins, including treating to new targets (TNT), Pravastatin or Atorvastatin Evaluation and Infection Therapy-Thromobolysis in Myocardial Infarction 22 (PROVE IT-TIMI 22), and Incremental Decrease in End Points Through Aggressive Lipid Lowering (IDEAL), showed that on-statin concentrations of HDL-C and TG were indicators of cardiovascular risk [6-8]. Evidence also indicated that apolipoprotein B (ApoB) or non-HDL-C concentrations contributed to the assessment of residual cardiovascular risk in patients with high cardiovascular risk [9]. Recent observations have highlighted the importance of remnant cholesterol as an independent predictor of CVD [10,11]. However, most studies evaluated the role of each lipid or lipoprotein parameter solely in a prediction model for residual cardiovascular risk. Because lipid and lipoprotein parameters are interrelated by nature; for example, LDL-C and non-HDL-C are positively or TG and HDL-C negatively [12], lipid parameters as predictors of CVD need to be assessed simultaneously, and their interactions should be considered.
- The study populations in previous studies were largely limited to patients with pre-existing CVD. Only a limited number of RCTs have been conducted exclusively on T2DM patients [13]. A paucity of data exists about the role of lipid and lipoprotein parameters in predicting cardiovascular events after statin therapy in patients with T2DM without CVD. Considering that the residual cardiovascular risk is greater in patients with T2DM than in those without [5,13] and since most adults with T2DM are taking statins [14], it is important to evaluate which lipid parameters are reliable for predicting future cardiovascular events in this patient population.
- This study aimed to evaluate and compare major lipid and lipoprotein parameters for predicting the first cardiovascular event in patients with T2DM taking statins in a real-world setting.
INTRODUCTION
- Data source and patient selection
- This study included a nationwide longitudinal population-based cohort of 514,866 Koreans from the Korean National Health Insurance Service-Health Screening Cohort (NHIS-HEALS). The cohort comprised participants in biannual health screening programs provided by the Korean government; this represented 10% of a random selection of all health-screening participants aged 40 to 79 years in 2002 and 2003 and followed up to 2015. The cohort database contains information on individuals’ demographics, disease records according to the International Classification of Disease, Tenth Revision (ICD-10), prescription records, hospitalizations, medical procedures, death records, and health examination data including questionnaires, anthropometric measures, and laboratory data. The details of the cohort protocol have been described previously [15].
- A flow diagram of the study patient selection is shown in Supplementary Fig. 1. From the original cohort (n=503,925), we selected patients who received moderate- or high-intensity statins for at least 90 days from 2007 to 2014. The index date was set to January 1, 2007, because a comprehensive measurement of lipid profiles, including total cholesterol (TC), LDL-C, HDL-C, and TG, has been conducted since 2007. To include at least a 1-year follow-up of patients, the last index date was set to December 31, 2014. Statin intensity was classified according to the 2013 American Heart Association (AHA)/American College of Cardiology (ACC) guideline on managing blood cholesterol [16]. Low-intensity statins included simvastatin 10 mg, pravastatin 10 to 20 mg, lovastatin 20 mg, fluvastatin 20 to 40 mg, and pitavastatin 1 mg. Moderate-intensity statins included atorvastatin 10 to 20 mg, rosuvastatin 5 to 10 mg, simvastatin 20 to 40 mg, pravastatin 40 to 80 mg, lovastatin 40 mg, fluvastatin XL 80 or 40 mg twice daily, and pitavastatin 2 to 4 mg. high-intensity statins included atorvastatin 40 to 80 mg and rosuvastatin 20 to 40 mg. Next, patients diagnosed with T2DM were selected. T2DM was classified on the basis of ICD-10 codes of T2DM (E11–14), with the use of at least one glucose-lowering agent, including insulin. Patients diagnosed with CVD before enrolment and those without documented lipid profiles before initiating statins were excluded. Patients’ history of CVD was identified by a medical history of ischemic heart disease (IHD), ischemic stroke (IS), and heart failure before the index date. The identification of IHD and IS are described in the outcome measures section, and a history of heart failure was identified as hospitalization for heart failure (ICD-10 codes I42, I43, and I50). Finally, 11,900 patients were included in the analyses. All patients were followed up from the index date of statin therapy to the earliest occurrence of any cardiovascular outcome described below, death, or the end of the cohort period (December 31, 2015).
- This study was approved by the Institutional Review Board of the Korea University Anam Hospital (IRB number ED17-181). None of the data involved any patient identity revealing information; thus, the NHIS waived the requirement for informed consent for this study.
- Outcome measures
- The primary outcome was the occurrence of any major adverse cardiovascular events (MACE), including IHD, IS, or cardiovascular death. IHD events were defined as hospitalization for IHD (ICD-10 codes I20-I25) plus documentation of coronary artery angiography or procedures. IS events were defined as hospitalization for IS (ICD-10 code I63) plus brain imaging studies or procedures for IS. Cardiovascular death was defined as death from CVD (ICD codes I00-I99).
- The risk of MACE was estimated according to on-treatment levels of LDL-C, TG, HDL-C, and non-HDL-C. TC, TG, and HDL-C levels were measured using enzymatic methods during fasting. LDL-C was measured directly when the TG level was 400 mg/dL or higher, otherwise, it was calculated by the Friedewald formula (TC minus HDL-C minus TG/5) [17]. Non-HDL-C was calculated by subtracting HDL-C from TC. The on-treatment lipid profile was defined as each lipid parameter on the most recent day to the event or study end after receiving statin therapy for at least 90 days without interruption following enrolment. Therapy was considered uninterrupted if the next prescription was filled within 30 days of the expected end date of the previous prescription. Analyses were also performed according to the patients’ baseline cardiovascular risk (moderate or high risk). The high-risk group was defined as patients with any of the following [18]: T2DM duration ≥10 years; estimated glomerular filtration rate (eGFR) <60 mL/min/1.73 m2; smoker; TC >310 mg/dL; LDL-C >190 mg/dL; or blood pressure ≥180/110 mm Hg. The moderate-risk group was defined as patients without these risk factors.
- Confounding variables
- The analyses were adjusted for confounding variables considered to potentially affect outcomes. Age and sex were adjusted in model A, and the following variables were further adjusted in model B: duration of diabetes, waist circumference, mean fasting blood sugar level, mean systolic blood pressure, smoking status (never, former, or current smokers), alcohol consumption (none, once or twice/week, or ≥3 times/week), physical activity (none, once or twice/week, or ≥3 times/week), duration of statin therapy, use of antihypertensive agents according to class (renin-angiotensin-aldosterone system inhibitors, calcium channel blockers, β-blockers, diuretics, or others), use of antidiabetic agents according to class (insulin, metformin, thiazolidinedione, sulfonylurea, dipeptidyl peptidase-4 inhibitor, or others), use of antithrombotic agents, and use of fenofibrate or omega-3 fatty acids. The duration of statin therapy was obtained by summing the length of continuous statin prescription without interruption from the 1st day of study enrolment to the last day of follow-up. In model C, additional adjustments for baseline LDL-C level and the other on-treatment lipid parameters were done. Analyses of LDL-C were adjusted for HDL-C and TG; analyses of TG were adjusted for LDL-C and HDL-C; analyses of HDL-C were adjusted for LDL-C and TG; and analyses of non-HDL-C were adjusted for TG.
- Statistical analysis
- Data are presented as means and standard deviations (SD) for continuous variables or as numbers (n) and percentages (%) for categorical variables. The risk of outcomes is presented as the hazard ratio (HR) and associated 95% confidence interval (CI) calculated using Cox proportional hazard regression models. Among patients achieving LDL-C levels less than 100 mg/dL, the prognostic effect of each lipid parameter for cardiovascular risk was assessed by calculating the HRs for MACE per 1-SD change in on-treatment values of each parameter (1-SD increase in LDL-C, TG, and non-HDL-C and 1-SD decrease in HDL-C). Subgroup analyses were performed according to on-treatment LDL levels (<55, 55–69, and 70–99 mg/dL) and according to patients’ baseline cardiovascular risk (moderate vs. high-risk). In addition, HRs were calculated by conventional categorization of each lipid parameter: LDL-C (<55, 55–69, and 70–99 mg/dL), TG (<100, 100–149, 150–199, and ≥200 mg/dL), HDL-C (<40, 40–49, 50–59, and ≥60 mg/dL), and non-HDL-C (<70, 70–99, 100–129, and ≥130 mg/dL). All statistical analyses were performed using SAS software version 9.4 (SAS Institute Inc., Cary, NC, USA). Statistical significance was set at a two-sided P value of <0.05.
METHODS
- Table 1 presents the baseline characteristics of the patients (n=11,900). The mean age was 63.2 years and 56.1% were male. Most patients (98.0%) received moderate-intensity statins, and 2.0% received high-intensity statins. The mean duration of statin therapy was 29.3 months. A total of 712 major cardiovascular events occurred during follow-up (median, 37.9 months [interquartile range, 21.7 to 54.9]): 427 patients developed IHD, 258 developed IS, and 71 died from CVD (Supplementary Table 1).
- The pre- and on-treatment lipid profiles with statin therapy are described in Supplementary Table 2. The mean LDL-C levels before and after statin therapy were 130.3 and 75.5 mg/dL, respectively. Overall, 84.9% of patients achieved LDL-C concentrations below 100 mg/dL following statin therapy.
- Major lipid parameters and residual cardiovascular risk
- Among patients who achieved LDL-C levels below 100 mg/dL with moderate- or high-intensity statin therapy (n=6,170), the HRs of MACE were estimated by on-treatment concentrations of LDL-C, TG, HDL-C, and non-HDL-C respectively (Fig. 1). There was a trend of increased HR as LDL-C, TG, and non-HDL-C levels increased, while HDL-C level decreased. Next, we calculated the adjusted HRs of MACE by 1-SD change in on-treatment concentrations of each lipid parameter (Table 2). After adjustment for age and sex (model A), most lipid parameters except TG were associated with major cardiovascular events; however, only LDL-C (adjusted HR, 1.30; 95% CI, 1.12 to 1.51) and non-HDL-C (adjusted HR, 1.26; 95% CI, 1.11 to 1.45) remained significant after adjustment for other confounding variables (model B). These associations were maintained even after further adjustments for the other on-treatment lipid parameters and baseline LDL-C levels (model C). Similar results were obtained in the analyses according to the conventional categorization of each lipid parameter (Supplementary Table 3).
- Subgroup analysis
- Subgroup analysis was performed according to the LDL-C level (Fig. 2). The associations between LDL-C, non-HDL-C and risk of MACE were significant in the subgroup with LDL-C level ≥70 and <100 mg/dL (adjusted HRs were 1.73 for LDL-C [95% CI, 1.15 to 2.61] and 1.59 for non-HDL-C [95% CI, 1.15 to 2.21]). In contrast, the associations weakened among patients with very low on-treatment LDL-C, in patients with LDL-C ≥55 and <70 mg/dL and those with LDL-C <55 mg/dL, although a significant interaction between subgroups did not exist.
- Supplementary Tables 4-6 present subgroup analyses according to the patient’s cardiovascular risk (moderate or high risk). In the high-risk group, on-statin LDL-C and non-HDL-C levels showed stronger predictive ability of MACE than other parameters, as in the overall analyses. In the moderate-risk group, the associations between on-treatment lipid parameters and the risk of MACE were not significant for all parameters, however, there was no significant interaction between groups.
RESULTS
- In this study, we found that the concentrations of LDL-C and non-HDL-C levels during statin therapy are more reliable predictors of first cardiovascular events than other lipid parameters in patients with T2DM. After adjustment for other lipid parameters and confounding variables, the on-statin LDL-C and non-HDL-C concentrations remained significant predictors of MACE, whereas TG and HDL-C did not. These associations were prominent in subjects with achieved LDL-C ≥70 mg/dL or at high cardiovascular risk, rather than those with lower LDL-C or at moderate cardiovascular risk.
- Since the pathogenic role of LDL-C in atheroma formation within the vasculature has been revealed [19], numerous studies have found a direct relationship between serum lipid or lipoprotein concentrations, especially TC and LDL-C, and CVD development. This association was clear from cohort studies in the general population, such as the Framingham heart study [20] and the seven countries study [21], which suggested that routine screening for cholesterol levels would help to predict cardiovascular risk. Statin therapy has become a mainstay strategy for cardiovascular risk reduction in at-risk populations [2,3], and assessment and management of residual cardiovascular risk among statin-treated patients has become an important issue. The assessment of residual cardiovascular risk with lipid or lipoprotein parameters has been conducted in post hoc analyses of statin RCTs, which have shown inconsistent results. For example, the on-treatment HDL-C level was an independent predictor of major cardiovascular events in the TNT study [6] but not in the Justification for the Use of Statins in Prevention: an Intervention Trial Evaluating Rosuvastatin (JUPITER) trial [22]. It is not clear why these studies yielded different results; however, it has been suggested that HDL-C may be a marker reflecting poor overall health rather than an independent risk factor for atherosclerotic CVD. Low HDL-C levels were found to be closely related to low incomes, unhealthy lifestyles, and other cardiac risk factors [23,24], and genetic analysis failed to show a causal association between HDL-C levels and myocardial infarction risk [25].
- The role of elevated TG levels in cardiovascular risk has also been debated. Lower TG levels were associated with lower cardiovascular risk in the PROVE IT-TIMI 22 trial [7] but not in meta-analysis, after adjusting for other risk factors [26]. A higher TG level is often a univariate predictor of CVD but not an independent predictor in multivariate analyses, probably due to TG being highly associated with abnormalities in HDL and LDL [27]. Similarly, in our studies, HDL-C and TG lost their significance after adjusting for other lipid parameters and confounding variables. These parameters partly predicted residual cardiovascular risk in high-risk patients; however, the predictive power of these parameters in overall analyses was not significant. Nonetheless, some evidence suggested that TG lowering, specifically with fenofibrate, is beneficial for cardiovascular risk reduction, especially in people with atherogenic dyslipidemia [28,29]. Since the median TG level was only 113 mg/dL, and the mean HDL-C level was 50 mg/dL after statin therapy in our study population, loss of predictive power of high TG or low HDL-C for cardiovascular risk may come from these favorable lipid profiles.
- In contrast, LDL-C and non-HDL-C, representative ApoB-containing lipoproteins, were consistently associated with the risk of MACE. The predictive ability of LDL-C and non-HDL-C was not weakened even after adjustment for other lipid parameters, indicating that these two parameters could be independent predictors of CVD in patients with T2DM. It is well known that ApoB-containing lipoproteins are implicated in the development of atherosclerosis [9]. Although LDL particles constitute most of the circulating ApoB-containing lipoproteins in fasting blood, very-low-density lipoprotein, intermediate-density lipoproteins, and lipoprotein(a) are also involved in the development of atherosclerosis. Hence, non-HDL-C has been proposed as an alternative for LDL-C, since several studies have shown that non-HDL-C is associated with cardiovascular risk as significantly as LDL-C or more strongly related to CVD than LDL-C [9,26,30]. Our study also shows that non-HDL-C is a significant predictor of residual cardiovascular risk, as is LDL-C.
- Notably, the residual cardiovascular risk differed by on-treatment LDL-C level in patients achieving 100 mg/dL with moderate- or high-intensity statin therapy, supporting that LDL-C level should be lowered far below 100 mg/dL, at least to 70 mg/dL, even in patients with T2DM without CVD. These associations were prominent in patients with additional risk factors. Although recent trials of proprotein convertase subtilisin/kexin 9 (PCSK9) inhibitors and ezetimibe strengthened the concept that lower LDL-C is better for cardio-protection, most of the trials included patients with established CVD [31,32]. Therefore, the level to which LDL-C should be lowered is unclear for T2DM patients without CVD. There are differences among the current guidelines regarding appropriate targets for LDL-C levels. The American Diabetes Association guidelines suggest appropriate statin intensity and percent change of LDL-C after therapy, but do not establish the specific target LDL concentrations [2]. While the European Society of Cardiology recommends patients with T2DM to achieve LDL-C levels below 70 mg/dL [3], the Korean Diabetes Association presents 100 mg/dL as the target LDL-C level for general patients with T2DM and 70 mg/dL for patients with CVD [33]. Our study population was T2DM patients without CVD, and most of them were non-obese people with preserved kidney function and well-controlled blood pressure. The differential power of LDL-C was more distinct in LDL-C levels between 70 and 100 mg/dL than below 70 mg/dL; thus, our study supports the lowering of LDL-C levels to less than 70 mg/dL in T2DM patients without CVD.
- This study has several limitations. First, this was a retrospective study that only established associations between risk factors and outcomes, but did not determine a cause-and-effect relationship. Although we tried to adjust for profound confounding variables, there might be other factors affecting the outcome. Second, one of the most important long-term glycaemic markers, glycosylated hemoglobin, was not adjusted for the analysis owing to a lack of relevant data. Instead, we adjusted the average fasting blood glucose level measured repetitively during the follow-up period. Third, the presence of target organ damage other than low eGFR, such as albuminuria, retinopathy, or neuropathy, was not used in risk stratification because there was no relevant data. Fourth, LDL-C-lowering therapies other than statins were not considered because ezetimibe was not used commonly and PCSK9 inhibitors were not approved in South Korea during the study period. Lastly, we could not evaluate the role of ApoB, lipoprotein(a), and other apolipoproteins because they were not contained in these data. Therefore, further investigation is needed to consider the missing parameters in predicting residual cardiovascular risk.
- In conclusion, on-treatment LDL-C and non-HDL-C levels performed better in the assessment of residual cardiovascular risk following statin therapy than other major lipid parameters in patients with T2DM without CVD. The predictive ability of on-statin LDL-C and non-HDL-C for MACE was prominent in patients at high cardiovascular risk and who achieved LDL-C ≥70 mg/dL, suggesting that LDL-C level should be lowered to <70 mg/dL for primary prevention of CVD in patients with T2DM.
DISCUSSION
SUPPLEMENTARY MATERIALS
Supplementary Table 2.
Supplementary Table 3.
Supplementary Table 4.
Supplementary Table 5.
Supplementary Table 6.
Supplementary Fig. 1.
-
CONFLICTS OF INTEREST
No potential conflict of interest relevant to this article was reported.
-
FUNDING
None
-
AUTHOR CONTRIBUTIONS
Conception or design: J.Y.K., S.G.K., N.H.K.
Acquisition, analysis, or interpretation of data: all authors.
Drafting the work or revising: J.Y.K., N.H.K.
Final approval of the manuscript: N.H.K.
NOTES
-
Acknowledgements
- We thank the participants of the Korean Health Insurance Cohort study as well as the National Health Insurance Service, that developed the NHIS-HEALS (2002–2015) database (NHIS2017-2-592).


| Variable | Adjusted HR (model A)a | Adjusted HR (model B)b | Adjusted HR (model C)c |
|---|---|---|---|
| LDL-C | 1.18 (1.03–1.36) | 1.30 (1.12–1.51) | 1.25 (1.07–1.47) |
| TG | 1.12 (0.99–1.26) | 1.04 (0.91–1.19) | 1.05 (0.91–1.21) |
| HDL-Cd | 1.27 (1.09–1.47) | 1.14 (0.97–1.34) | 1.16 (0.98–1.37) |
| Non-HDL-C | 1.27 (1.11–1.45) | 1.26 (1.11–1.45) | 1.31 (1.09–1.57) |
Values are presented as adjusted HR (95% confidence interval). The SD for lipid parameters are 17.68 for LDL-C, 73.92 for TG, 12.69 for HDL-C, and 20.84 for non-HDL-C.
SD, standard deviation; LDL-C, low-density lipoprotein cholesterol; HR, hazard ratio; TG, triglyceride; HDL-C, high-density lipoprotein cholesterol.
a Adjusted for age and sex,
b Adjusted for model A plus duration of diabetes, waist circumference, mean fasting blood glucose, mean systolic blood pressure, smoking, alcohol consumption, physical activity, duration of statin therapy, and concurrent medications (antihypertensive agents by class, antidiabetic agents by class, antithrombotic agents, fenofibrate, and omega-3 fatty acids),
c Adjusted for model B plus other on-treatment lipid parameters and baseline LDL-C levels,
d HR per 1-SD decrease of HDL-C.
- 1. Mooradian AD. Dyslipidemia in type 2 diabetes mellitus. Nat Clin Pract Endocrinol Metab 2009;5:150-9.ArticlePubMedPDF
- 2. American Diabetes Association Professional Practice Committee. 10. Cardiovascular disease and risk management: standards of medical care in diabetes-2022. Diabetes Care 2022;45(Suppl 1):S144-74.ArticlePubMedPDF
- 3. Visseren FL, Mach F, Smulders YM, Carballo D, Koskinas KC, Back M, et al. 2021 ESC guidelines on cardiovascular disease prevention in clinical practice. Eur Heart J 2021;42:3227-337.PubMed
- 4. Fruchart JC, Sacks F, Hermans MP, Assmann G, Brown WV, Ceska R, et al. The residual risk reduction initiative: a call to action to reduce residual vascular risk in patients with dyslipidemia. Am J Cardiol 2008;102(10 Suppl):1K-34K.ArticlePubMed
- 5. Dash S, Leiter LA. Residual cardiovascular risk among people with diabetes. Diabetes Obes Metab 2019;21 Suppl 1:28-38.ArticlePubMedPDF
- 6. Barter P, Gotto AM, LaRosa JC, Maroni J, Szarek M, Grundy SM, et al. HDL cholesterol, very low levels of LDL cholesterol, and cardiovascular events. N Engl J Med 2007;357:1301-10.ArticlePubMed
- 7. Miller M, Cannon CP, Murphy SA, Qin J, Ray KK, Braunwald E, et al. Impact of triglyceride levels beyond low-density lipoprotein cholesterol after acute coronary syndrome in the PROVE IT-TIMI 22 trial. J Am Coll Cardiol 2008;51:724-30.ArticlePubMed
- 8. Faergeman O, Holme I, Fayyad R, Bhatia S, Grundy SM, Kastelein JJ, et al. Plasma triglycerides and cardiovascular events in the Treating to New Targets and Incremental Decrease in End-Points through Aggressive Lipid Lowering trials of statins in patients with coronary artery disease. Am J Cardiol 2009;104:459-63.ArticlePubMed
- 9. Boekholdt SM, Arsenault BJ, Mora S, Pedersen TR, LaRosa JC, Nestel PJ, et al. Association of LDL cholesterol, non-HDL cholesterol, and apolipoprotein B levels with risk of cardiovascular events among patients treated with statins: a meta-analysis. JAMA 2012;307:1302-9.PubMed
- 10. Langsted A, Madsen CM, Nordestgaard BG. Contribution of remnant cholesterol to cardiovascular risk. J Intern Med 2020;288:116-27.ArticlePubMedPDF
- 11. Castaner O, Pinto X, Subirana I, Amor AJ, Ros E, Hernaez A, et al. Remnant cholesterol, not LDL cholesterol, is associated with incident cardiovascular disease. J Am Coll Cardiol 2020;76:2712-24.ArticlePubMed
- 12. Lawler PR, Akinkuolie AO, Chu AY, Shah SH, Kraus WE, Craig D, et al. Atherogenic lipoprotein determinants of cardiovascular disease and residual risk among individuals with low low-density lipoprotein cholesterol. J Am Heart Assoc 2017;6:e005549.ArticlePubMedPMC
- 13. Colhoun HM, Betteridge DJ, Durrington PN, Hitman GA, Neil HA, Livingstone SJ, et al. Primary prevention of cardiovascular disease with atorvastatin in type 2 diabetes in the Collaborative Atorvastatin Diabetes Study (CARDS): multicentre randomised placebo-controlled trial. Lancet 2004;364:685-96.ArticlePubMed
- 14. Seo DH, Kang S, Lee YH, Ha JY, Park JS, Lee BW, et al. Current management of type 2 diabetes mellitus in primary care clinics in Korea. Endocrinol Metab (Seoul) 2019;34:282-90.ArticlePubMedPMCPDF
- 15. Seong SC, Kim YY, Park SK, Khang YH, Kim HC, Park JH, et al. Cohort profile: the National Health Insurance Service-National Health Screening Cohort (NHIS-HEALS) in Korea. BMJ Open 2017;7:e016640.ArticlePubMedPMC
- 16. Stone NJ, Robinson JG, Lichtenstein AH, Bairey Merz CN, Blum CB, Eckel RH, et al. 2013 ACC/AHA guideline on the treatment of blood cholesterol to reduce atherosclerotic cardiovascular risk in adults: a report of the American College of Cardiology/American Heart Association Task Force on Practice Guidelines. Circulation 2014;129(25 Suppl 2):S1-45.PubMed
- 17. Friedewald WT, Levy RI, Fredrickson DS. Estimation of the concentration of low-density lipoprotein cholesterol in plasma, without use of the preparative ultracentrifuge. Clin Chem 1972;18:499-502.ArticlePubMedPDF
- 18. Mach F, Baigent C, Catapano AL, Koskinas KC, Casula M, Badimon L, et al. 2019 ESC/EAS guidelines for the management of dyslipidaemias: lipid modification to reduce cardiovascular risk. Eur Heart J 2020;41:111-88.ArticlePubMedPDF
- 19. Brown MS, Goldstein JL. Lipoprotein metabolism in the macrophage: implications for cholesterol deposition in atherosclerosis. Annu Rev Biochem 1983;52:223-61.ArticlePubMed
- 20. Wilson PW, Castelli WP, Kannel WB. Coronary risk prediction in adults (the Framingham Heart Study). Am J Cardiol 1987;59:91G-4G.ArticlePubMed
- 21. Verschuren WM, Jacobs DR, Bloemberg BP, Kromhout D, Menotti A, Aravanis C, et al. Serum total cholesterol and longterm coronary heart disease mortality in different cultures: twenty-five-year follow-up of the seven countries study. JAMA 1995;274:131-6.ArticlePubMed
- 22. Ridker PM, Genest J, Boekholdt SM, Libby P, Gotto AM, Nordestgaard BG, et al. HDL cholesterol and residual risk of first cardiovascular events after treatment with potent statin therapy: an analysis from the JUPITER trial. Lancet 2010;376:333-9.ArticlePubMed
- 23. Ko DT, Alter DA, Guo H, Koh M, Lau G, Austin PC, et al. High-density lipoprotein cholesterol and cause-specific mortality in individuals without previous cardiovascular conditions: the CANHEART study. J Am Coll Cardiol 2016;68:2073-83.PubMed
- 24. Barter P, Genest J. HDL cholesterol and ASCVD risk stratification: a debate. Atherosclerosis 2019;283:7-12.ArticlePubMed
- 25. Voight BF, Peloso GM, Orho-Melander M, Frikke-Schmidt R, Barbalic M, Jensen MK, et al. Plasma HDL cholesterol and risk of myocardial infarction: a Mendelian randomisation study. Lancet 2012;380:572-80.PubMedPMC
- 26. Emerging Risk Factors Collaboration, Di Angelantonio E, Sarwar N, Perry P, Kaptoge S, Ray KK, et al. Major lipids, apolipoproteins, and risk of vascular disease. JAMA 2009;302:1993-2000.ArticlePubMedPMC
- 27. Brunzell JD, Davidson M, Furberg CD, Goldberg RB, Howard BV, Stein JH, et al. Lipoprotein management in patients with cardiometabolic risk: consensus statement from the American Diabetes Association and the American College of Cardiology Foundation. Diabetes Care 2008;31:811-22.PubMed
- 28. ACCORD Study Group, Ginsberg HN, Elam MB, Lovato LC, Crouse JR 3rd, Leiter LA, et al. Effects of combination lipid therapy in type 2 diabetes mellitus. N Engl J Med 2010;362:1563-74.ArticlePubMedPMC
- 29. Bruckert E, Labreuche J, Deplanque D, Touboul PJ, Amarenco P. Fibrates effect on cardiovascular risk is greater in patients with high triglyceride levels or atherogenic dyslipidemia profile: a systematic review and meta-analysis. J Cardiovasc Pharmacol 2011;57:267-72.ArticlePubMed
- 30. Welsh C, Celis-Morales CA, Brown R, Mackay DF, Lewsey J, Mark PB, et al. Comparison of conventional lipoprotein tests and apolipoproteins in the prediction of cardiovascular disease. Circulation 2019;140:542-52.ArticlePubMedPMC
- 31. Cannon CP, Blazing MA, Giugliano RP, McCagg A, White JA, Theroux P, et al. Ezetimibe added to statin therapy after acute coronary syndromes. N Engl J Med 2015;372:2387-97.ArticlePubMed
- 32. Sabatine MS, Giugliano RP, Keech AC, Honarpour N, Wiviott SD, Murphy SA, et al. Evolocumab and clinical outcomes in patients with cardiovascular disease. N Engl J Med 2017;376:1713-22.ArticlePubMed
- 33. Hur KY, Moon MK, Park JS, Kim SK, Lee SH, Yun JS, et al. 2021 Clinical practice guidelines for diabetes mellitus of the Korean Diabetes Association. Diabetes Metab J 2021;45:461-81.ArticlePubMedPMCPDF
REFERENCES
Figure & Data
References
Citations
 PubReader
 ePub Link
 Cite
Cite- Figure
-


- Related articles
-
- Comparative Efficacy of Rosuvastatin Monotherapy and Rosuvastatin/Ezetimibe Combination Therapy on Insulin Sensitivity and Vascular Inflammatory Response in Patients with Type 2 Diabetes Mellitus
- Optimal Low-Density Lipoprotein Cholesterol Level for Primary Prevention in Koreans with Type 2 Diabetes Mellitus
- Implication of Sex Differences in Visceral Fat for the Assessment of Incidence Risk of Type 2 Diabetes Mellitus
- Not Control but Conquest: Strategies for the Remission of Type 2 Diabetes Mellitus


