
- Current
- Browse
- Collections
-
For contributors
- For Authors
- Instructions to authors
- Article processing charge
- e-submission
- For Reviewers
- Instructions for reviewers
- How to become a reviewer
- Best reviewers
- For Readers
- Readership
- Subscription
- Permission guidelines
- About
- Editorial policy
Articles
- Page Path
- HOME > Diabetes Metab J > Volume 47(6); 2023 > Article
-
Original ArticleMetabolic Risk/Epidemiology Prediabetes Progression and Regression on Objectively- Measured Physical Function: A Prospective Cohort Study
-
Shanhu Qiu1,2
 , Yiming Zhu3, Bo Xie1,2, Wenji Chen1,2, Duolao Wang4, Xue Cai5, Zilin Sun3, Tongzhi Wu6
 -
Diabetes & Metabolism Journal 2023;47(6):859-868.
DOI: https://doi.org/10.4093/dmj.2022.0377
Published online: August 23, 2023
- 1,297 Views
- 122 Download
1Department of General Practice, Institute of Diabetes, Zhongda Hospital, School of Medicine, Southeast University, Nanjing, China
2Research and Education Centre of General Practice, Zhongda Hospital, Southeast University, Nanjing, China
3Department of Endocrinology, Institute of Diabetes, Zhongda Hospital, School of Medicine, Southeast University, Nanjing, China
4Department of Clinical Sciences, Liverpool School of Tropical Medicine, Liverpool, UK
5Department of Nursing Management, Zhongda Hospital, School of Medicine, Southeast University, Nanjing, China
6Adelaide Medical School and Centre of Research Excellence (CRE) in Translating Nutritional Science to Good Health, The University of Adelaide, Adelaide, Australia
-
Corresponding authors: Xue Cai Department of Nursing Management, Zhongda Hospital, School of Medicine, Southeast University, Dingjiaqiao No.87, Nanjing 210009, China E-mail: kameyuki@126.com
-
Zilin Sun Department of Endocrinology, Institute of Diabetes, Zhongda Hospital, School of Medicine, Southeast University, Dingjiaqiao No.87, Nanjing 210009, China E-mail: sunzilin1963@126.com
Copyright © 2023 Korean Diabetes Association
This is an Open Access article distributed under the terms of the Creative Commons Attribution Non-Commercial License (http://creativecommons.org/licenses/by-nc/4.0/) which permits unrestricted non-commercial use, distribution, and reproduction in any medium, provided the original work is properly cited.
ABSTRACT
-
Background
- Prediabetes leads to declines in physical function in older adults, but the impact of prediabetes progression or regression on physical function is unknown. This study assessed this longitudinal association, with physical function objectivelymeasured by grip strength, walking speed, and standing balance, based on the Health and Retirement Study enrolling United States adults aged >50 years.
-
Methods
- Participants with prediabetes were followed-up for 4-year to ascertain prediabetes status alteration (maintained, regressed, or progressed), and another 4-year to assess their impacts on physical function. Weak grip strength was defined as <26 kg for men and <16 kg for women, slow walking speed was as <0.8 m/sec, and poor standing balance was as an uncompleted fulltandem standing testing. Logistic and linear regression analyses were performed.
-
Results
- Of the included 1,511 participants with prediabetes, 700 maintained as prediabetes, 306 progressed to diabetes, and 505 regressed to normoglycemia over 4 years. Grip strength and walking speed were declined from baseline during the 4-year follow-up, regardless of prediabetes status alteration. Compared with prediabetes maintenance, prediabetes progression increased the odds of developing weak grip strength by 89% (95% confidence interval [CI], 0.04 to 2.44) and exhibited larger declines in grip strength by 0.85 kg (95% CI, –1.65 to –0.04). However, prediabetes progression was not related to impairments in walking speed or standing balance. Prediabetes regression also did not affect any measures of physical function.
-
Conclusion
- Prediabetes progression accelerates grip strength decline in aging population, while prediabetes regression may not prevent physical function decline due to aging.
- Physical function describes the ability of an individual to undertake different physical tasks in daily living and is considered an important indicator of body performance [1,2]. Objective-measures of physical function, which in general includes grip strength, walking speed, and standing balance, declines with aging, leading to increased risks of disability and frailty [3,4]. Moreover, population-based studies have shown that in older adults, a decline in physical function is also predictive of future cardiovascular events and all-cause mortality [1,5]. Maintaining adequately functioning physical function or preventing declines in physical function is therefore of significant importance in promoting healthy aging.
- Prediabetes is a common metabolic disorder during aging, which affects approximately one-half of the United States and the Chinese adults aged >50 years [6,7]. In a recent longitudinal study enrolling 2,013 older adults from the Swedish National Study on Aging and Care in Kungsholmen, individuals with prediabetes exhibited more rapid declines in chair-rising time (a measure for muscle strength) and walking speed than those with normoglycemia [8], underscoring the importance to assess physical function in the aging population with prediabetes as a clinical routine.
- However, prediabetes is an intermediate dysglycemic status, which may either progress to diabetes, remain unchanged, or regress to normoglycemia during its natural history [9,10]. While previous studies have suggested that prediabetes progression predisposes individuals to increased risks of cardiovascular and all-cause mortality [11], and that prediabetes regression lowers the risks of cardiovascular events [12], the impact of prediabetes progression or regression on physical function remains unknown. To fill in these gaps, we conducted this study in community-dwellers with prediabetes aged >50 years based on the Health and Retirement Study (HRS) that had a prospective cohort design [13], wherein physical function was objectively-measured by grip strength, timed walking, and standing tests.
INTRODUCTION
- Study participants
- HRS is an ongoing longitudinal survey of nationally representative community-dwellers aged >50 years in United States that is sponsored by the National Institute on Aging (grant number NIA U01AG009740) and is conducted by the University of Michigan [13], and its design is detailed on http://hrsonline.isr.umich.edu/. Since 2006, one-half of the HRS participants were randomly selected for an enhanced face-to-face interview, which included measurements of physical function and blood biomarkers, with the remaining (the other one-half of participants in 2006 survey) completing the same interview in 2008 [14]. This rotation design had continued for all the following biennial HRS surveys, resulting in a 4-year time-window for the periodic follow-up on the measures of physical function and blood biomarkers. The protocol of HRS was approved by the Institutional Review Board at the University of Michigan (approved no. HUM00061128). All respondents in HRS had provided written informed consent. The present study was conducted according to the guideline of Strengthening the Reporting of Observational Studies in Epidemiology.
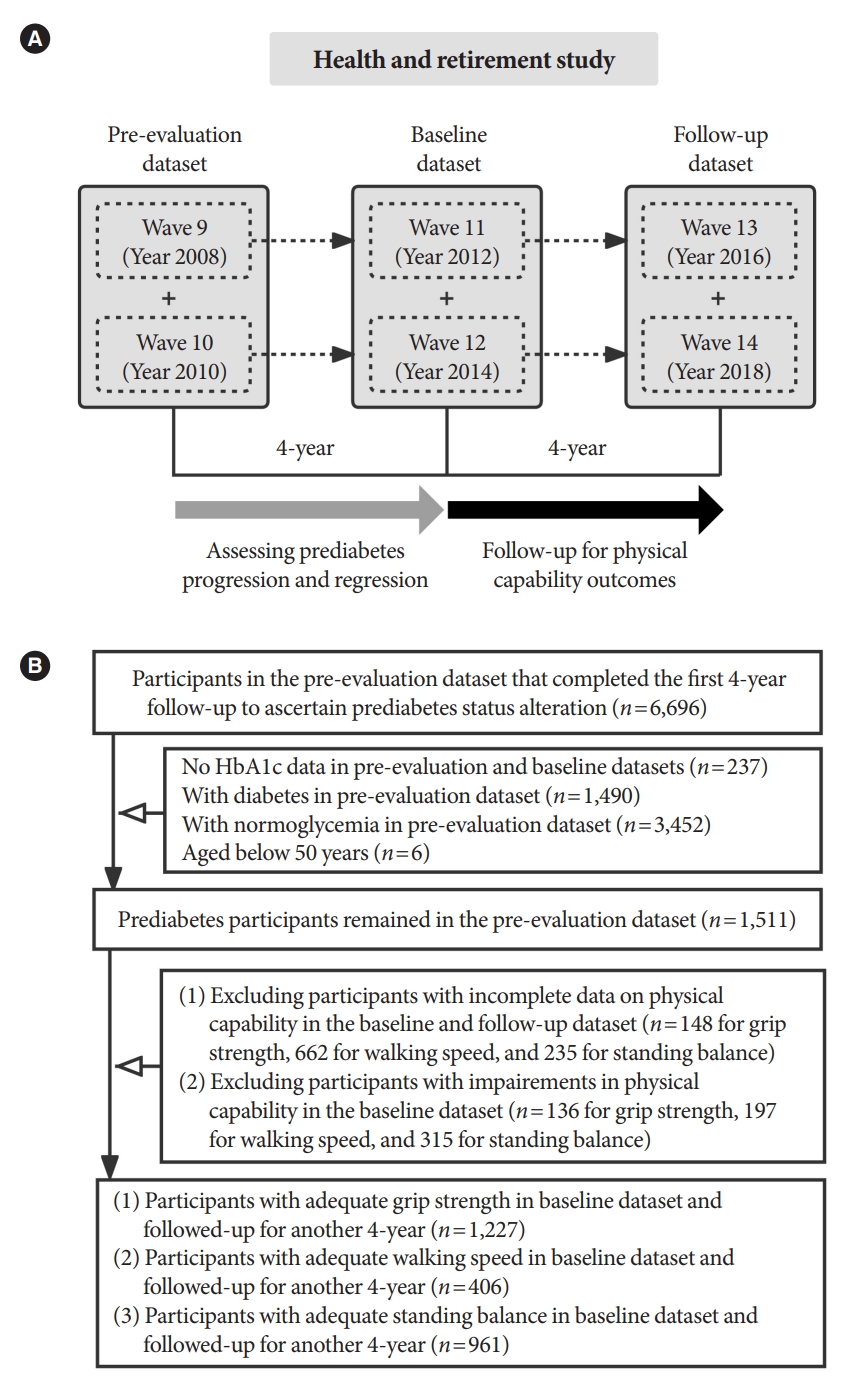
- Considering the 4-year turn-around time as aforementioned and to increase statistical power, we created three sequential datasets based on the HRS surveys, namely the pre-evaluation (data combined from 2008 and 2010 waves), baseline (data combined from 2012 and 2014 waves), and follow-up (data combined from 2016 and 2018 waves) datasets. For them, the preevaluation dataset was used to identify participants with prediabetes, the baseline dataset was to ascertain prediabetes status alteration (that is, prediabetes progression, regression, and maintenance), and the follow-up dataset was to assess the impact of prediabetes status alteration on physical function (Fig. 1A).
- Following this design, and after excluding participants with normoglycemia or diabetes in the pre-evaluation dataset or those with incomplete data on glycosylated hemoglobin (HbA1c) to ascertain prediabetes or prediabetes status alteration in the baseline or follow-up datasets, we included 1,511 participants aged >50 years, who were identified as prediabetes in the pre-evaluation dataset. The detailed selection process is described in Fig. 1B.
- Covariables
- Since prediabetes status alteration was determined in the baseline dataset and given our aim was to assess the association of prediabetes status alteration on physical function, the following covariables in the baseline dataset were included in the analysis.
- Demographic data (age and sex), lifestyle message (history of drinking and smoking and physical exercise), and health conditions (history of diabetes, chronic lung disease, arthritis, and Alzheimer’s disease) were obtained by questionnaires. Anthropometric parameters including body weight and height were measured, and body mass index (BMI) was calculated as weight divided by the square of height (kg/m2). Systolic and diastolic blood pressure were recorded as averages of three measurements at rest.
- Biomarkers including HbA1c, total cholesterol (TC), high-density lipoprotein cholesterol (HDL-C), and C-reactive protein (CRP) were measured using dried blood spot samples These biomarker data were calibrated against the whole-blood assays, and the transformed scores were employed for the present study [15]. Missing data on blood pressure, BMI, TC, HDL-C, and CRP in the baseline dataset were imputed using the Markov Chain Monte Carlo method.
- Measurement of physical function
- Two measurements were performed for each hand, and the averages from the dominant hand were used. Grip strength was analyzed as both: (1) a binary variable categorized as with or without weak grip strength (cut-offs: <26 kg for men and <16 kg for women) [3,16], and (2) a continuous variable.
- Participants were asked to walk 2.5 m at the usual pace two times, with the walking time being recorded. Walking speed was analyzed as both: (1) a binary variable as with or without slow walking speed (cut-off: <0.8 m/sec) [3], and (2) a continuous variable.
- Participants were asked to perform the semi-tandem standing test [13]. If failed, they were asked to perform the side-by-side standing test; or if succeeded, to perform the full-tandem standing test. Standing balance was considered a binary variable and was categorized as with or without poor standing balance (that is, an uncompleted full-tandem standing test).
- Changes in grip strength and walking speed were calculated as the follow-up scores minus the baseline scores.
- Definition of prediabetes status alteration
- The classifications of prediabetes, diabetes, and normoglycemia were defined based on the American Diabetes Association criteria: prediabetes: HbA1c 5.7% to 6.4% (39 to 47 mmol/mol); diabetes: HbA1c ≥6.5% (48 mmol/mol), and/or self-reported history (including the use of anti-diabetes medications); and normoglycemia: HbA1c <5.7% (39 mmol/mol) [17]. In the baseline dataset, we referred prediabetes maintenance to participants who maintained as prediabetes from preevaluation dataset, prediabetes progression to participants who progressed to diabetes from prediabetes, and prediabetes regression to participants who regressed to normoglycemia from prediabetes.
- Statistical analysis
- Differences in baseline characteristics were compared using chi-square test for categorical variables and independent t-tests for continuous variables. Logistic and linear regression analyses were conducted to estimate the odds ratios (ORs) and 95% confidence intervals (CIs) of developing impaired physical function (including weak grip strength, slow walking speed, or poor standing balance) at follow-up and to assess the associations of the mean changes in physical function related to prediabetes progression or regression compared with prediabetes maintenance, respectively, in participants without impaired physical function. For these analyses, three models were employed: model 1 including only prediabetes status alteration; model 2 adjusted for age, sex, and BMI; and model 3 additionally adjusted for history of smoking and drinking (yes or no), taking physical exercise (yes or no), history of chronic lung disease, arthritis, and Alzheimer’s disease (with or without), diastolic blood pressure, HbA1c, TC/HDL-C, CRP, and the corresponding measures of physical function.
- We also performed several sensitivity analyses: (1) defining prediabetes using the International Expert Committee criterion (HbA1c 6.0% to 6.4% [42 to 47 mmol/mol]); (2) using different cut-off points for ascertaining low grip strength (<32 kg for men and <20 kg for women) [16,18] or slow walking speed (<0.6 m/sec) [16]; (3) excluding participants with data imputation; (4) excluding participants developed diabetes at follow-up; and (5) restricting participants to those who maintained glycemic status unchanged during the follow-up from the baseline dataset.
- Data analyses were conducted from June 11, 2021 to February 21, 2022. All the analyses were performed using Stata version 14.0 (StataCorp LP, College Station, TX, USA), with P<0.05 considered statistically significant.
METHODS
Grip strength: assessed using the hand dynamometers
Walking speed: assessed using a timed walking test
Standing balance: assessed by the semi-tandem, side-by-side, and full-tandem standing tests
- Characteristics of study participants at baseline
- A total of 1,511 prediabetes participants from the pre-evaluation dataset were included. Of them, 700 participants maintained as prediabetes, 306 progressed to diabetes, and 505 regressed to normoglycemia after 4-year follow-up (in the baseline dataset). Upon the exclusion of participants with impaired physical function in the baseline dataset (Fig. 1B), there were 1,227 participants with adequately functioning grip strength (that is, without low grip strength), 406 with adequately functioning walking speed (that is, without slow walking speed), and 961 with adequately functioning standing balance (that is, without poor standing balance). Their characteristics are shown in Supplementary Table 1. During the 4-year follow-up, 151, 209, and 274 participants developed weak grip strength, slow walking speed, and poor standing balance, respectively.
- Moreover, after the 4-year follow-up (in the follow-up dataset), 863 participants provided sufficient data to ascertain glycemic status (Supplementary Table 2). Among them, participants who maintained as prediabetes in the baseline dataset had a higher percentage of developing diabetes but a lower percentage of returning to normoglycemia compared with those who regressed to normoglycemia (35.1% vs. 10.7%, P<0.001; and 19.7% vs. 48.9%, P<0.001; respectively).
- Prediabetes progression and regression on grip strength over 4 years
- In comparison with participants who did not develop weak grip strength, those who developed (n=151) were older, had lower diastolic blood pressure, and were less likely to smoke and perform physical exercise (all P≤0.03) (Table 1). Using prediabetes maintenance as the reference, prediabetes progression was not associated with increased odds of developing weak muscle strength in model 1 or 2 (Table 2). However, this association became significant in the multivariable model (OR, 1.89; 95% CI, 1.04 to 3.44, model 3). Grip strength was declined during the 4-year follow-up from the baseline dataset, regardless of prediabetes status alteration (all P<0.001) (Table 3). Prediabetes progression was also associated with larger declines in grip strength compared with prediabetes maintenance (mean change: –3.47 kg vs. –2.75 kg, P<0.05 for model 3). However, prediabetes regression was not associated with decreased odds of developing weak grip strength or smaller declines in grip strength in any model (Tables 2 and 3).
- Prediabetes progression and regression on walking speed over 4 years
- Participants who developed slow walking speed (n=209) were older and had higher levels of CRP than those who did not develop during the 4-year follow-up (both P≤0.05) (Table 1). Walking speed was declined during the 4-year follow-up from the baseline dataset, regardless of prediabetes status alteration (all P<0.001) (Table 3). However, neither prediabetes progression nor prediabetes regression were associated with the odds of developing slow walking speed or causing any changes in walking speed in any model, compared with prediabetes maintenance (Tables 2 and 3).
- Prediabetes progression and regression on standing balance over 4 years
- Participants who developed poor standing balance (n=274) had older age and higher levels of CRP, and were less likely to perform physical exercise than those who did not develop during the 4-year follow-up (all P≤0.001) (Table 1). Neither prediabetes progression nor prediabetes regression were associated with the odds of developing poor standing balance, compared with prediabetes maintenance (Table 2).
- Sensitivity analyses on physical function over 4 years
- Using HbA1c 6.0% to 6.4% (42 to 47 mmol/mol) from the International Expert Committee criterion to diagnose prediabetes, or employing different cut-offs to define weak grip strength or slow walking speed, did not significantly affect the associations of prediabetes progression or regression with physical function in all models during the 4-year follow-up (Supplementary Tables 3 and 4), compared with the primary analyses. These associations remained generally unchanged, after excluding participants with missing information (Supplementary Table 5), or those developed diabetes during the 4-year follow-up (Supplementary Table 6). Yet prediabetes progression was not associated with weak muscle strength when restricting participants to those who maintained glycemic status unchanged during the follow-up from the baseline dataset (Supplementary Table 7).
RESULTS
- Main findings
- Our study showed for the first time in the aging population with prediabetes that: (1) prediabetes progression was associated with increased odds of developing weak grip strength and greater declines in grip strength, but unrelated to impairments in walking speed or standing balance, compared with prediabetes maintenance; and (2) prediabetes regression was not related to any changes in physical function and might be not able to prevent the declines in physical function due to aging.
- Interpretations and implications
- Previous studies have extensively explored the associations of impairments in physical function with poor health outcomes such as sarcopenia and disability [1,19], and the determinants underling impaired physical function in older adults [20]. However, no studies have assessed the impacts of prediabetes status alteration on physical function in an aging population. Extending from a prior observation that prediabetes, as opposed to normoglycemia, predisposes to a faster decline in chair-rising time and walking speed than normoglycemia [8], our study showed that prediabetes progression resulted in a greater reduction in grip strength by 0.8 kg and increased odds of developing weak grip strength by 89% in adults aged >50 years during the 4-year follow-up, compared with prediabetes maintenance. This indicates that prediabetes progression may accelerate the declines in muscle strength. On the basis of the currently available evidence [21-23], the association of prediabetes progression with weak grip strength may have been accounted for by elevated blood pressure, deteriorated lipid profiles, and increased body weight.
- However, we did not show sufficient evidence that prediabetes progression was related to decreased odds of developing low walking speed or poor standing balance. This discrepancy is in line with the association of cardiometabolic health (which is also linked to prediabetes progression [24]) with upper limb muscle strength (reflected by grip strength), but not with lower limb muscle strength (e.g., walking speed and standing balance [25]) [26]. Although the non-significant outcomes on walking speed or standing balance may be attributable to the small sample size, particularly for the data on walking speed, it is plausible that grip strength might outperform other measures of physical function in reflecting changes in physical function in the aging population.
- Of note, our study showed that prediabetes regression was not associated with any decreased odds of developing impaired physical function or could prevent declines in any objectively-measured physical function during the follow-up. Although the probability of regression to normoglycemia is significantly higher than that of progression to diabetes in prediabetes participants in the natural history [9], this does not necessary mean that promoting prediabetes regression is of limited value, in particular considering the findings that prediabetes regression is associated with reduced odds of future cardiovascular events and death [12]. It should be noted that prediabetes regression in our study occurred without intentional interventions, such as the use of metformin and exercise [24]. The modest improvements in glycemia without deliberate interventions may be insufficient to achieve significant benefits on physical function. Moreover, prediabetes was ascertained based on a single HbA1c (in the absence of blood glucose levels), which might be inadequate to fully elucidate the health benefits of prediabetes regression. It is also possible that the follow-up duration (only 4 years) for detecting differences in physical function resulted from prediabetes regression in our study might be too short. Accordingly, future studies assessing the effects of prediabetes regression by intentional interventions (e.g., metformin use [23]) or by HbA1c-plus glucose-based definitions, on physical function, with a longer follow-up duration, in older adults are therefore warranted.
- Our study analyzed the association of prediabetes progression and regression on physical function, with prediabetes progression and regression ascertained in the baseline dataset from the pre-evaluation dataset. However, glycemic status would be subject to further changes during the follow-up. In our study we found that participants with prediabetes who once regressed to normoglycemia had a lower percentage of developing diabetes and a higher percentage of returning to normoglycemia during the follow-up, compared with participants who consistently maintained as prediabetes. This is partly in line with the outcomes from prior reports [23,27], in which regression to normoglycemia was found to be associated with reduced risk of future diabetes. However, when restricting participants to those who maintained glycemic status unchanged in the follow-up dataset, we did not find that prediabetes progression was significantly associated with weak muscle strength. This may reflect a type II error due to the small sample size in this sub-dataset and therefore a lack of sufficient statistical power (Supplementary Table 7).
- Strengths and limitations
- The strengths of our study include the longitudinal design with a diverse and national sample of United States adults aged >50 years, the repeated and objective measurements of different physical function, and the robustness of our main results evidenced by a series of sensitivity analyses. However, several limitations should be noted while interpreting our study findings. First, the glycemic status of participants relied on the measurement of HbA1c only, the lack of fasting plasma glucose and 2-hour plasma glucose after a 75 g oral glucose in HRS might have caused underestimation of the incidence of prediabetes progression or regression. For the same reason, it was not possible to assess whether HbA1c-based prediabetes definition differs from glucose-based definition on physical function. As a result, the observed effects may be subject to unobserved confounding factors. Second, the diagnostic cut-off point of HbA1c on prediabetes remains controversial; for example, the International Expert Committee suggests a range of 6.0% to 6.4% (42 to 47 mmol/mol) rather than 5.7% to 6.4% (39 to 47 mmol/mol) from the American Diabetes Association [26,28]. However, our sensitivity analysis (Supplementary Table 3) indicated that this discrepancy was unlikely to influence our study conclusions. Third, specific cut-off points in defining impaired physical function remain debatable [3,29], but the outcomes of our study remained robust by employing alternative cut-off points (Supplementary Table 4). Fourth, despite the effort to reduce the likelihood of reverse causality by excluding participants with suboptimal physical function at entry and controlling for covariables such as demographic parameters, lifestyle message, and blood biomarkers, the observational nature of prospective cohort studies cannot adequately ascertain the causal relationship between prediabetes progression or regression and physical function in the aging population. Finally, the sample size for the analysis on walking speed was small and the 4-year follow-up duration was relatively short, so that findings from our study might need to be validated by prospective studies with larger sample sizes and longer-term follow-ups.
DISCUSSION
- In conclusion, prediabetes progression increased the odds of developing weak grip strength and accelerated the declines in grip strength, but prediabetes regression was unlikely to prevent any declines in physical function compared with prediabetes maintenance. Our findings support the concept of preventing prediabetes progression to promote healthy aging in adults aged >50 years and suggest that assessment of grip strength might be a highly sensitive measure to detect functional declines during aging.
Conclusions
SUPPLEMENTARY MATERIALS
Supplementary Table 1.
Supplementary Table 2.
Supplementary Table 3.
Supplementary Table 4.
Supplementary Table 5.
Supplementary Table 6.
Supplementary Table 7.
-
CONFLICTS OF INTEREST
No potential conflict of interest relevant to this article was reported.
-
AUTHOR CONTRIBUTIONS
Conception or design: S.Q., X.C., Z.S., T.W.
Acquisition, analysis, or interpretation of data: S.Q., Y.Z., B.X., X.C., W.C., Z.S.
Drafting the work or revising: S.Q., B.X., D.W., T.W.
Final approval of the manuscript: all authors.
-
FUNDING
This work was partly supported by the Aging Health Scientific Research Project in Jiangsu (grant No. LKM2022027), the Key Research Base of Philosophy and Social Sciences of Jiangsu Education Department (grant No. 2022B04), the Chinese Nursing Association (grant no. ZHKYQ202117), and the Key Research and Development Program in Jiangsu Province (grant No. BE2022828). Shanhu Qiu has been supported by the “Best Young Scholars” Fellowship from Southeast University. Tongzhi Wu is supported by a Mid-Career Fellowship from the Hospital Research Foundation. The funders had no role in study design, data collection and analysis, decision to publish, or preparation of the manuscript.
NOTES
-
Acknowledgements
- None
| Variable |
Weak grip strength at follow-up |
Slow walking speed at follow-up |
Poor standing balance at follow-up |
|||||||
|---|---|---|---|---|---|---|---|---|---|---|
| With | Without | P value | With | Without | P value | With | Without | P value | ||
| No. of participantsa | 151 | 1,076 | 209 | 197 | 274 | 687 | ||||
| Male sex | 65 (43.0) | 420 (39.0) | 0.17 | 89 (42.6) | 86 (43.7) | 0.41 | 91 (33.2) | 313 (45.6) | <0.001 | |
| Age, yr | 75.7±8.8 | 68.2±8.3 | <0.001 | 74.8±6.4 | 72.8±5.4 | <0.001 | 71.5±9.3 | 67.1±7.7 | <0.001 | |
| BMI, kg/m2 | 30.2±5.2 | 30.8±6.1 | 0.14 | 29.5±5.4 | 29.3±5.2 | 0.34 | 30.5±6.1 | 30.1±5.6 | 0.19 | |
| SBP, mm Hg | 132±19 | 130±18 | 0.08 | 132±18 | 132±19 | 0.42 | 131±19 | 129±19 | 0.09 | |
| DBP, mm Hg | 77±12 | 79±11 | 0.009 | 77±10 | 79±11 | 0.08 | 78±10 | 79±10 | 0.09 | |
| HbA1c, % | 5.9±0.5 | 5.9±0.6 | 0.42 | 5.9±0.6 | 5.8±0.5 | 0.16 | 5.9±0.5 | 5.9±0.6 | 0.24 | |
| HbA1c, mmol/mol | 41±5.5 | 41±6.6 | 0.42 | 41±6.6 | 40±5.5 | 0.16 | 41±5.5 | 41±6.6 | 0.24 | |
| TC/HDL-C | 3.7±0.8 | 3.9±1.2 | 0.03 | 3.8±0.9 | 3.8±1.0 | 0.42 | 3.8±1.0 | 3.9±1.2 | 0.28 | |
| ln(CRP), mg/dL | 0.4±1.7 | 0.5±1.4 | 0.31 | 0.4±1.3 | 0.1±1.5 | 0.05 | 0.6±1.2 | 0.2±1.5 | 0.001 | |
| Smokingb | 9 (6.0) | 120 (11.2) | 0.03 | 10 (4.8) | 14 (7.1) | 0.16 | 27 (9.2) | 63 (9.9) | 0.37 | |
| Drinkingb | 82 (54.3) | 603 (56.0) | 0.34 | 135 (64.6) | 130 (66.0) | 0.38 | 149 (54.4) | 401 (58.4) | 0.13 | |
| Taking exercise | 53 (35.1) | 500 (46.5) | 0.004 | 97 (46.4) | 107 (54.3) | 0.06 | 109 (40.0) | 365 (53.1) | <0.001 | |
| With history of | ||||||||||
| CLD | 15 (9.9) | 94 (8.7) | 0.31 | 23 (11.0) | 11 (5.6) | 0.02 | 34 (12.4) | 40 (5.8) | <0.001 | |
| Arthritis | 106 (70.2) | 632 (58.7) | 0.004 | 131 (62.7) | 129 (65.5) | 0.28 | 182 (66.4) | 379 (55.2) | <0.001 | |
| AD | 1 (0.7) | 3 (0.3) | 0.22 | 2 (1.0) | 0 | 0.08 | 1 (0.4) | 0 | 0.06 | |
Values are presented as number (%) or mean±standard deviation.
BMI, body mass index; SBP, systolic blood pressure; DBP, diastolic blood pressure; HbA1c, glycosylated hemoglobin; TC, total cholesterol; HDL-C, high-density lipoprotein cholesterol; CRP, C-reactive protein; CLD, chronic lung disease; AD, Alzheimer's disease.
a Participants were with adequately functioning grip strength, walking speed, or standing balance, respectively, in the baseline dataset,
b They represented participants who were current smokers or had history of drinking.
Mode 1: without adjustment; Model 2: adjusted for age, sex, and body mass index; Model 3: additionally adjusted for history of smoking and drinking (yes or no), taking physical exercise (yes or no), history of chronic lung disease (with or without), arthritis (with or without), and Alzheimer’s disease (with or without), diastolic blood pressure, glycosylated hemoglobin, total cholesterol/high-density lipoprotein cholesterol, and C-reactive protein, and corresponding physical function (except standing balance) at baseline.
a The classifications of prediabetes, diabetes, and normoglycemia were defined based on the 2021 American Diabetes Association criteria.
Values are presented as mean±standard deviation or change (95% confidence interval). Model 1: without adjustment; Model 2: adjusted for age, sex, and body mass index; Model 3: additionally adjusted for history of smoking and drinking (yes or no), taking physical exercise (yes or no), history of chronic lung disease (with or without), arthritis (with or without), and Alzheimer’s disease (with or without), diastolic blood pressure, glycosylated hemoglobin, total cholesterol/high-density lipoprotein cholesterol, and C-reactive protein, and corresponding physical function at baseline.
a The classifications of prediabetes, diabetes, and normoglycemia were defined based on the 2021 American Diabetes Association criteria.
- 1. Cooper R, Kuh D, Cooper C, Gale CR, Lawlor DA, Matthews F, et al. Objective measures of physical capability and subsequent health: a systematic review. Age Ageing 2011;40:14-23.ArticlePubMedPMC
- 2. Qiu S, Cai X, Zheng P, Yuan Y, Xu Y, Jia L, et al. Changes in objectively-measured physical capability over 4-year, risk of diabetes, and glycemic control in older adults: the China Health and Retirement Longitudinal study. Diabetes Res Clin Pract 2022;184:109186.ArticlePubMed
- 3. Cruz-Jentoft AJ, Bahat G, Bauer J, Boirie Y, Bruyere O, Cederholm T, et al. Sarcopenia: revised European consensus on definition and diagnosis. Age Ageing 2019;48:601.ArticlePubMedPMCPDF
- 4. de Oliveira DC, de Oliveira Maximo R, Ramirez PC, de Souza AF, Luiz MM, Delinocente ML, et al. Is slowness a better discriminator of disability than frailty in older adults? J Cachexia Sarcopenia Muscle 2021;12:2069-78.ArticlePubMedPMCPDF
- 5. Cooper R, Strand BH, Hardy R, Patel KV, Kuh D. Physical capability in mid-life and survival over 13 years of follow-up: British birth cohort study. BMJ 2014;348:g2219.ArticlePubMedPMC
- 6. Hostalek U. Global epidemiology of prediabetes: present and future perspectives. Clin Diabetes Endocrinol 2019;5:5.ArticlePubMedPMCPDF
- 7. Li Y, Teng D, Shi X, Qin G, Qin Y, Quan H, et al. Prevalence of diabetes recorded in mainland China using 2018 diagnostic criteria from the American Diabetes Association: national cross sectional study. BMJ 2020;369:m997.ArticlePubMedPMC
- 8. Shang Y, Fratiglioni L, Vetrano DL, Dove A, Welmer AK, Xu W. Not only diabetes but also prediabetes leads to functional decline and disability in older adults. Diabetes Care 2021;44:690-8.ArticlePubMedPMCPDF
- 9. Rooney MR, Rawlings AM, Pankow JS, Echouffo Tcheugui JB, Coresh J, Sharrett AR, et al. Risk of progression to diabetes among older adults with prediabetes. JAMA Intern Med 2021;181:511-9.ArticlePubMedPMC
- 10. Lazo-Porras M, Bernabe-Ortiz A, Ruiz-Alejos A, Smeeth L, Gilman RH, Checkley W, et al. Regression from prediabetes to normal glucose levels is more frequent than progression towards diabetes: the CRONICAS Cohort Study. Diabetes Res Clin Pract 2020;163:107829.ArticlePubMedPMC
- 11. Liu X, Wu S, Song Q, Wang X. Reversion from pre-diabetes mellitus to normoglycemia and risk of cardiovascular disease and all-cause mortality in a Chinese population: a prospective cohort study. J Am Heart Assoc 2021;10:e019045.ArticlePubMedPMC
- 12. Vistisen D, Kivimaki M, Perreault L, Hulman A, Witte DR, Brunner EJ, et al. Reversion from prediabetes to normoglycaemia and risk of cardiovascular disease and mortality: the Whitehall II cohort study. Diabetologia 2019;62:1385-90.ArticlePubMedPMCPDF
- 13. Sonnega A, Faul JD, Ofstedal MB, Langa KM, Phillips JW, Weir DR. Cohort profile: the Health and Retirement Study (HRS). Int J Epidemiol 2014;43:576-85.ArticlePubMedPMC
- 14. Peterson MD, Casten K, Collins S, Hassan H, Garcia-Hermoso A, Faul J. Muscle weakness is a prognostic indicator of disability and chronic disease multimorbidity. Exp Gerontol 2021;152:111462.ArticlePubMedPMC
- 15. Bardenheier BH, Wu WC, Zullo AR, Gravenstein S, Gregg EW. Progression to diabetes by baseline glycemic status among middle-aged and older adults in the United States, 2006-2014. Diabetes Res Clin Pract 2021;174:108726.ArticlePubMed
- 16. Kim ES, Kawachi I, Chen Y, Kubzansky LD. Association between purpose in life and objective measures of physical function in older adults. JAMA Psychiatry 2017;74:1039-45.ArticlePubMedPMC
- 17. American Diabetes Association. 2. Classification and diagnosis of diabetes: standards of medical care in diabetes-2019. Diabetes Care 2019;42(Suppl 1):S13-28.ArticlePubMedPDF
- 18. Duchowny KA, Peterson MD, Clarke PJ. Cut points for clinical muscle weakness among older Americans. Am J Prev Med 2017;53:63-9.ArticlePubMedPMC
- 19. Kitamura A, Seino S, Abe T, Nofuji Y, Yokoyama Y, Amano H, et al. Sarcopenia: prevalence, associated factors, and the risk of mortality and disability in Japanese older adults. J Cachexia Sarcopenia Muscle 2021;12:30-8.ArticlePubMedPMCPDF
- 20. Yu R, Ong S, Cheung O, Leung J, Woo J. Reference values of grip strength, prevalence of low grip strength, and factors affecting grip strength values in Chinese adults. J Am Med Dir Assoc 2017;18:551.Article
- 21. Perreault L, Temprosa M, Mather KJ, Horton E, Kitabchi A, Larkin M, et al. Regression from prediabetes to normal glucose regulation is associated with reduction in cardiovascular risk: results from the Diabetes Prevention Program outcomes study. Diabetes Care 2014;37:2622-31.ArticlePubMedPMCPDF
- 22. de Abreu L, Holloway KL, Kotowicz MA, Pasco JA. Dysglycaemia and other predictors for progression or regression from impaired fasting glucose to diabetes or normoglycaemia. J Diabetes Res 2015;2015:373762.PubMedPMC
- 23. Pratte KA, Johnson A, Beals J, Bullock A, Manson SM, Jiang L, et al. Regression to normal glucose regulation in American Indians and Alaska natives of a diabetes prevention program. Diabetes Care 2019;42:1209-16.ArticlePubMedPMCPDF
- 24. Tabak AG, Herder C, Rathmann W, Brunner EJ, Kivimaki M. Prediabetes: a high-risk state for diabetes development. Lancet 2012;379:2279-90.ArticlePubMedPMC
- 25. Wu F, Callisaya M, Laslett LL, Wills K, Zhou Y, Jones G, et al. Lower limb muscle strength is associated with poor balance in middle-aged women: linear and nonlinear analyses. Osteoporos Int 2016;27:2241-8.ArticlePubMedPDF
- 26. Qiu S, Cai X, Yuan Y, Xie B, Sun Z, Wang D, et al. Muscle strength and prediabetes progression and regression in middle-aged and older adults: a prospective cohort study. J Cachexia Sarcopenia Muscle 2022;13:909-18.ArticlePubMedPMCPDF
- 27. Perreault L, Pan Q, Mather KJ, Watson KE, Hamman RF, Kahn SE, et al. Effect of regression from prediabetes to normal glucose regulation on long-term reduction in diabetes risk: results from the Diabetes Prevention Program Outcomes Study. Lancet 2012;379:2243-51.ArticlePubMedPMC
- 28. International Expert Committee. International Expert Committee report on the role of the A1C assay in the diagnosis of diabetes. Diabetes Care 2009;32:1327-34.ArticlePubMedPMCPDF
- 29. Abellan van Kan G, Rolland Y, Andrieu S, Bauer J, Beauchet O, Bonnefoy M, et al. Gait speed at usual pace as a predictor of adverse outcomes in community-dwelling older people an International Academy on Nutrition and Aging (IANA) Task Force. J Nutr Health Aging 2009;13:881-9.ArticlePubMedPDF
 PubReader
 ePub Link
 Cite
Cite


