- Current
- Browse
- Collections
-
For contributors
- For Authors
- Instructions to authors
- Article processing charge
- e-submission
- For Reviewers
- Instructions for reviewers
- How to become a reviewer
- Best reviewers
- For Readers
- Readership
- Subscription
- Permission guidelines
- About
- Editorial policy
Articles
- Page Path
- HOME > Diabetes Metab J > Volume 45(3); 2021 > Article
-
Original ArticleComplications Association between Sleep Quality and Painless Diabetic Peripheral Neuropathy Assessed by Current Perception Threshold in Type 2 Diabetes Mellitus
-
Dughyun Choi
 , Bo-Yeon Kim, Chan-Hee Jung, Chul-Hee Kim, Ji-Oh Mok
 -
Diabetes & Metabolism Journal 2021;45(3):358-367.
DOI: https://doi.org/10.4093/dmj.2019.0219
Published online: August 6, 2020
Division of Endocrinology and Metabolism, Department of Internal Medicine, Soonchunhyang University Bucheon Hospital, Soonchunhyang University College of Medicine, Bucheon, Korea
-
Corresponding author: Ji-Oh Mok Division of Endocrinology and Metabolism, Department of Internal Medicine, Soonchunhyang University Bucheon Hospital, Soonchunhyang University College of Medicine, 170 Jomaru-ro, Wonmi-gu, Bucheon 14584, Korea. hanna@schmc.ac.kr
Copyright © 2021 Korean Diabetes Association
This is an Open Access article distributed under the terms of the Creative Commons Attribution Non-Commercial License (http://creativecommons.org/licenses/by-nc/4.0/) which permits unrestricted non-commercial use, distribution, and reproduction in any medium, provided the original work is properly cited.
ABSTRACT
-
Background
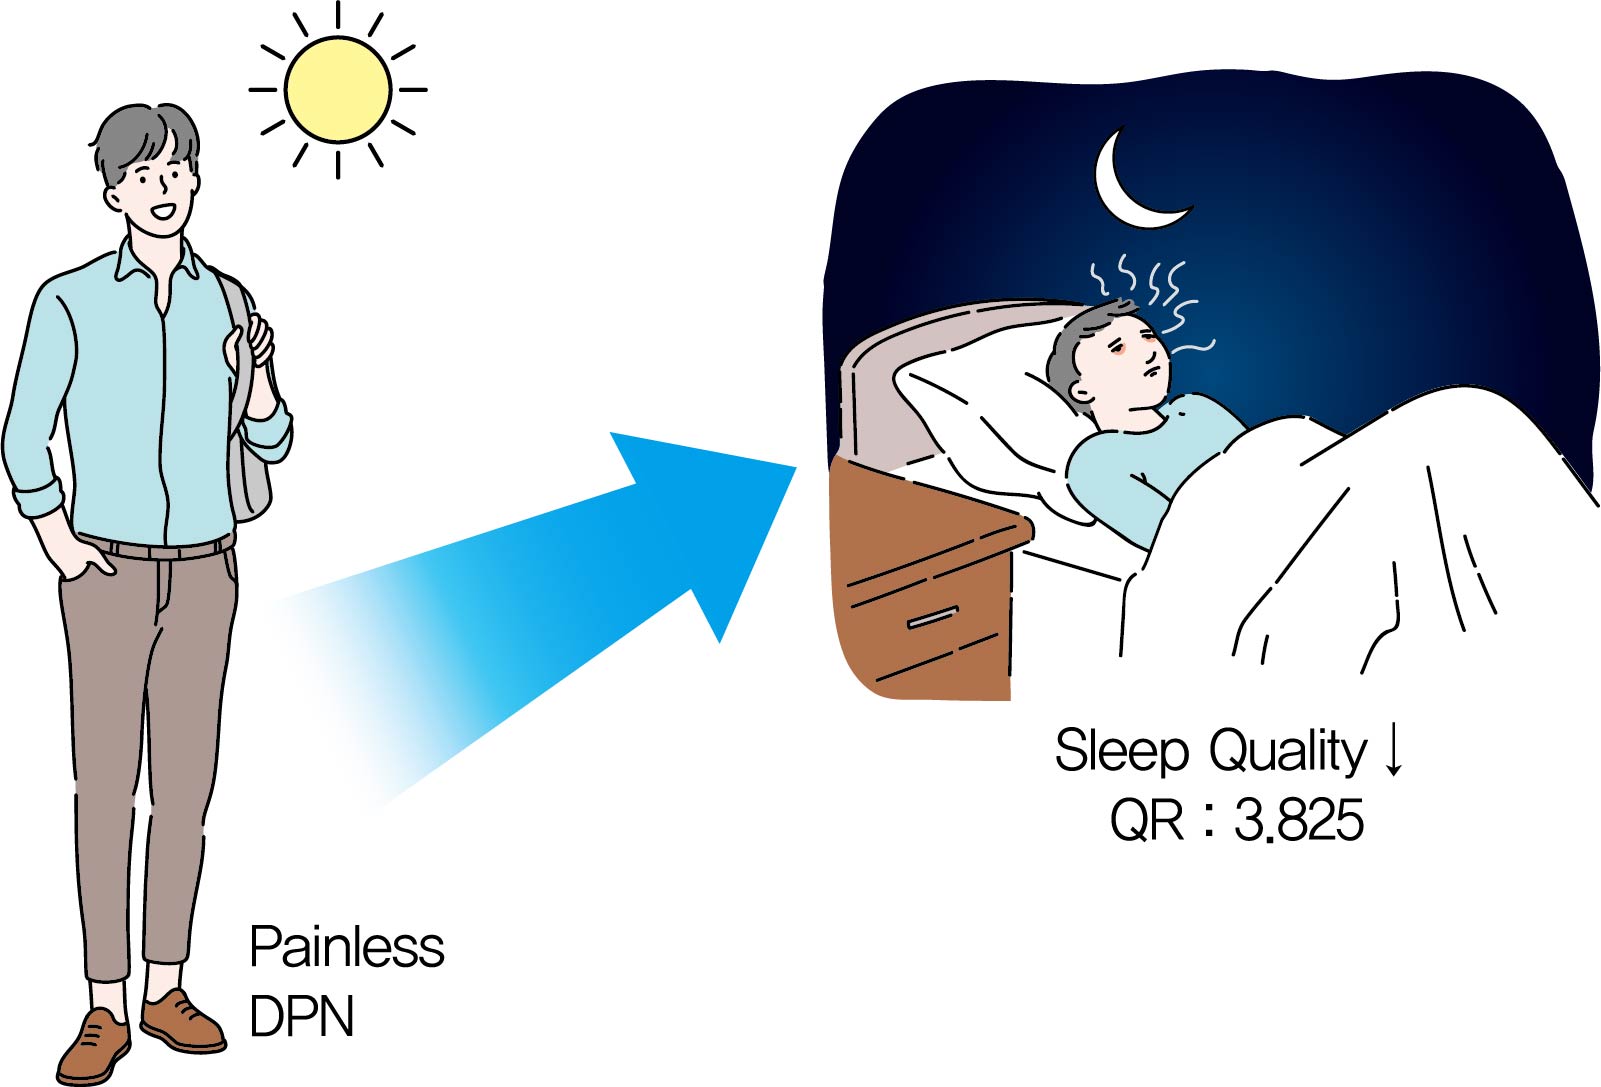
- It is known that the painful sensation of diabetic peripheral neuropathy (DPN) results in sleep problems in type 2 diabetes mellitus (T2DM). However, it is not known that the painless DPN also is associated with poor sleep quality in T2DM. The purpose of the current study was to investigate the association between painless DPN and poor sleep quality in T2DM.
-
Methods
- A total of 146 patients of T2DM who do not have any painful symptoms of DPN were recruited into the study. Among the patients, painless DPN was diagnosed by using the current perception threshold test. Sleep quality was assessed using the Pittsburgh Sleep Quality Index questionnaire.
-
Results
- The percentage of painless DPN was significantly higher in the poor sleep quality group than the good sleep quality group (70.0% vs. 35.5%, P<0.001). In the subscale results, stimulus values at 2,000 Hz, hypoesthesia and hyperesthesia were more common in the poor sleep quality group than in the good sleep quality group (45.7% vs. 25.0%, P=0.009; 34.3% vs. 18.4%, P=0.029; 40.0% vs. 19.7%, P=0.007, respectively). The association of painless DPN and poor sleep quality remained significant after adjustment for significant covariates (odds ratio, 3.825; 95% confidence interval, 1.674 to 8.742; P<0.001).
-
Conclusion
- The current study showed that painless DPN was associated with poor sleep quality. Future studies are required to clarify the pathophysiologic causal relationship between painless DPN and sleep quality.
- Type 2 diabetes mellitus (T2DM) is a metabolic disorder based on insulin resistance and beta-cell dysfunction, leading to numerous diabetic complications and morbidities, negatively affecting the quality of life of the patients [12]. Although a difference in prevalence rates exists depending on the measurement method, sleep problems are more common in T2DM patients than in the general population, and approximately 33% to 50% of T2DM patients have been reported to have sleep problems [345]. In addition, sleep disorders are thought to play an important role in the development and aggravation of T2DM by the neuro-metabolic pathway [678]. However, among the many factors and consequences of T2DM, independent risk factors that adversely affect sleep quality have yet to be clarified.
- Diabetic peripheral neuropathy (DPN) is one of the most common and early manifested complication in T2DM. DPN involves progressive damage to various types of nerve fibers and is characterized by a variety of heterogeneous sensations, including decreased sensation and paresthesia, as well as painful sensations [9]. The diagnosis of DPN is principally based on clinical symptoms, but up to half of the DPN patients may be asymptomatic, in a condition called subclinical or painless DPN [910]. Previous studies reported that painful sensations of DPN resulted in sleep problems, and more severe pain led to worse sleep quality [11121314]. Since DPN develops on a background of prolonged hyperglycemia associated with various metabolic abnormalities, factors other than painful sensory symptoms could also induce poor sleep quality in DPN patients. However, aside from the pain of symptomatic DPN, the association between sleep problems and painless DPN has not been studied previously.
- The purpose of this study was to investigate the relationship between painless DPN and sleep quality, using the current perception threshold (CPT) test and Pittsburgh Sleep Quality Index (PSQI) questionnaire.
INTRODUCTION
- Study population
- T2DM patients who admitted the Endocrinology and Metabolism department of Soonchunhyang University Bucheon Hospital from January 2016 to December 2018 were reviewed. 415 T2DM patients were hospitalized for treatment of uncontrolled hyperglycemia during this period. Except for 229 patients who already diagnosed as symptomatic DPN or who were in acute medical or surgical conditions, 186 patients completed both CPT and PSQI for evaluation of DPN and sleep quality. Including six depression, 18 patients with conditions that could cause sleep disorders other than diabetes were excluded. In addition, those (n=22) with taking peripheral neuropathy medications (gabapentin, pregabalin, thioctic acid, γ-linoleic acid, duloxetine, tricyclic antidepressants, opioids, and other painkillers) that can affect the CPT or PSQI results were also excluded. Finally, 146 patients (83 men, 63 women) who were not previously diagnosed with symptomatic DPN were enrolled in the study (Fig. 1). We reviewed detailed demographic, laboratory data and treatment history from patients' medical records. The current study was approved by the Institutional Review Board of Soonchunhyang University Bucheon Hospital (IRB No. 2019-03-005). Since our study was retrospective review of medical records, patients' consent was exempted.
- Sleep quality assessment
- PSQI, a self-administered questionnaire which assesses subjective sleep quality and disturbance over a prior 1 month period was used to evaluate the sleep quality of the patients [15]. PSQI is widely used in various clinical populations to distinguish between good sleepers and bad sleepers [16171819]. We obtained the original PSQI form from the University of Pittsburgh Center for Sleep and Circadian Science homepage (https://www.sleep.pitt.edu/) with permission. It consists of 19 items, grouped into seven subscales measuring self-reported sleep quality, sleep latency, sleep duration, habitual sleep efficiency, sleep disturbance, use of sleep medications, and daytime dysfunction [15]. Each of the seven subscales is scored from 0 to 3, and the sum of components provides a global PSQI score, ranging from a low of 0 to a high of 21. Scores ≤5 are defined as good quality sleepers, and >5 as poor quality sleepers [15].
- Anthropometric and biochemical measurements
- Body weight and height were measured to the nearest 0.1 kg and 0.1 cm, respectively. Body mass index (BMI) was calculated by dividing the body weight (kg) by the height squared (square meters). Laboratory biochemical markers were measured, including fasting plasma glucose (FPG), glycated albumin, glycosylated hemoglobin (HbA1c), fasting insulin, aspartate aminotransferase (AST), alanine aminotransferase (ALT), total cholesterol (TC), low density lipoprotein cholesterol (LDL-C), high density lipoprotein cholesterol (HDL-C), and triglyceride (TG). Estimated glomerular filtration rate (eGFR) was calculated using the Modification of Diet in Renal Disease (MDRD) equation [eGFR (mL/min/1.73 m2)=186×serum creatinine (mg/dL)−1.154×(age)−0.203×(0.742, if female)×(1.21, if black)] [20]. Homeostasis model assessment of insulin resistance (HOMA-IR) was used to assess the insulin resistance and calculated by the following formula: [fasting insulin (µIU/mL)×FPG (mmol/L)]/22.5 [21]. Subcutaneous fat thickness (SFT) and visceral fat thickness (VFT) were measured in millimeters using ultrasonography. SFT was defined as the maximal thickness of the fat layer from the skin-fat interface to the linea alba, and VFT was defined as the distance from the anterior wall of the aorta to the posterior aspect of the rectus abdominis muscle [22].
- Painless diabetic peripheral neuropathy assessment
- All the participants were not taking any peripheral neuropathy medications and did not have a history of previously diagnosed DPN. To diagnose painless DPN among them, CPT was measured using Neurometer CPT/C (Neurotron Inc., Baltimore, MD, USA). CPT is a widely used neuro-selective quantitative test because of its high sensitivity, simple operability and non-invasiveness. CPT uses three kinds of different impulse frequencies (2,000, 250, and 5 Hz) to assess the patient's ability to detect a controlled electrical stimulus [23]. Each of the three frequencies represents the functional status of distinct nerve fibers: large myelinated (A-beta) fibers, small myelinated (A-delta) fibers, and small unmyelinated (C) fibers, respectively [2425]. A-beta-fibers conduct cutaneous touch and pressure sensations, A-delta-fibers conduct deep mechanoreceptors and sharp/fast pain, and the C-fibers conduct temperature and dull/slow pain [25]. CPT measurements were taken from four sites. Bilateral measurements were obtained from the median nerve on the index finger and the deep and the superficial peroneal nerves on the first toe. Threshold values above the reference range are considered to indicate hypoesthesia and results below the reference range are considered to indicate hyperesthesia [2627]. Hypoesthesia is mainly affected by large fiber neuropathy. On the other hand, hyperesthesia is mainly affected by relatively small fiber neuropathy [28]. Either hypoesthesia or hyperesthesia indicates the presence of DPN [29]. All the patients were administered the CPT test by the same skilled operator.
- Statistical analysis
- Statistical analysis was conducted using SPSS Statistics version 26.0 (IBM Corp., Armonk, NY, USA). For the data analysis, the independent two-sample t-test was used for continuous variables and the chi-square test was used for categorical variables. Continuous variables were expressed as mean±standard deviation and categorical variables were expressed as a number of patients (percentages). Among the variables, fasting serum insulin, HOMA-IR, AST, ALT, TC, HDL-C, and TG showed skewed distribution and were log-transformed before the analysis. Mean values of skewed distributed variables were presented untransformed, but P values were based on logarithmic data. Logistic regression analysis was conducted to determine which variables predicted high risk for poor sleep quality. Based on the results of univariate analysis, multivariate regression analysis was conducted to adjust for factors that might affect the CPT results on poor sleep quality. Odds ratio (OR) was used to evaluate the association between poor sleep quality and variables, including CPT results. P values of <0.05 were taken to indicate statistical significance.
METHODS
- General characteristics of study participants according to sleep quality
- Demographic characteristics of participants by sleep quality are shown in Table 1. There was no significant difference between the two groups in mean age, sex ratio, duration of T2DM, hypertension prevalence, smoking, and alcohol intake history. Among the anthropometric variables, BMI, VFT, and SFT were significantly higher in the poor sleep quality group than the good sleep quality group. The proportion of patients using insulins, statins, and angiotensin II receptor blocker (ARB) showed a higher tendency in the poor sleep quality group than the good sleep quality group, but the differences were not statistically significant.
- Laboratory data of study participants according to sleep quality
- Table 2 indicates the laboratory data of participants, grouped by sleep quality. Glycemic indicators including FPG, glycated albumin, and HbA1c showed no significant difference between the two groups. Fasting insulin levels and calculated HOMA-IR were higher in the poor sleep quality group and the differences were statistically significant for HOMA-IR. There was no statistical difference between AST, ALT, TC, LDL-C, HDL-C, TG, and eGFR of the two groups.
- Painless diabetic peripheral neuropathy and quality of sleep
- Association between painless DPN and sleep quality are shown in Supplementary Fig. 1. Painless DPN was more prevalent in the poor sleep quality group than in the good sleep quality group. In the good sleep quality group, 35.5% had painless DPN whereas, in the poor sleep quality group, 70.0% had painless DPN (P<0.001). Table 3 shows subscale analysis results of CPT compared between the two sleep quality groups. In subscale results of CPT, 2,000 Hz stimulus showed a significant difference. In the good sleep quality group, 25.0% had an abnormal response to 2,000 Hz stimulus whereas, in the poor sleep quality group, 45.7% had an abnormal response (P=0.009). However, stimuli of 5 and 250 Hz showed no significant differences between the two groups. On the other hand, both hypoesthesia and hyperesthesia were more common in the poor sleep quality group than good sleep quality group. Good sleep quality group showed 18.4% of hypoesthesia and 19.7% of hyperesthesia, whereas poor sleep quality group showed 34.3% of hypoesthesia and 40.0% of hyperesthesia (P=0.029 and P=0.007, respectively). When comparing each Hz of CPT threshold values in both hands and feet, threshold at 2,000 Hz showed significant differences in 2 points (left hand and right foot). Threshold at 250 and 5 Hz showed a difference in 1 point each (left hand and right foot, respectively) (Supplementary Table 1).
- Comparison of global PSQI scores, subscales, and poor sleep quality frequency between painless DPN and no DPN were indicated in Table 4. Global PSQI score, sleep latency, sleep duration, sleep efficiency, and poor sleep quality frequency were significantly higher in the painless DPN group than the no DPN group.
- Logistic regression analysis of variables on poor sleep quality is shown in Table 5. In the univariate analysis, BMI, VFT, SFT, HOMA-IR, and painless DPN showed statistical significance. The association between painless DPN and poor sleep quality remained significant after multivariate adjustment for significant covariates (OR, 3.825; 95% confidence interval, 1.674 to 8.742; P=0.001).
RESULTS
- The present study revealed a significant association between painless DPN and poor sleep quality, even after adjustment for confounding factors. In addition, subscale results of CPT indicated abnormalities in the 2,000 Hz test, hypoesthesia, and hyperesthesia. Among these subscale parameters, 2,000 Hz and hypoesthesia are known to represent large fiber neuropathy.
- Painful DPN and painless DPN share many common elements, but there are also differences between the two diseases. Painful DPN is associated more with obesity and greater autonomic dysfunction than painless DPN [3031]. A study by Blesneac et al. [32] suggested a possibility of genetic difference between painful DPN and painless DPN by examining variants in the voltage-gated sodium channel Nav1.7. Unlike painless DPN which was found to have no genetic variant in 78 patients, 10 out of 111 painful DPN patients showed genetic variants. A recent report performed by Shillo et al. [33] studied difference between painful and painless DPN. According to the study, small fiber neuropathy was more severely manifested in the painful DPN. Considering that small fiber neuropathy manifests as pain, it can be assumed that small nerve fiber neuropathy is more prominent in painful DPN than in painless DPN [30]. On the other hand, large nerve fibers are considered to be more related to painless DPN [28].
- Previously reported studies on painful DPN and poor sleep quality showed that the painful sensation of DPN leads to poor sleep quality [1112]. Gore et al. [11] reported that greater sleep problem was found in painful DPN patients than the general United States population. In a study of Zelman et al. [12], painful DPN showed significantly impaired sleep relative to the general population, the chronic disease sample, and postherpetic neuralgia patients. Both studies used the Medical Outcomes Study (MOS) Sleep Scale to evaluate sleep quality. To the best of our knowledge, however, no studies have investigated the association between painless DPN and poor sleep quality. This study found significant differences in 2,000 Hz responses and hypoesthesia subscale results, indicators of large fiber neuropathy, between sleep quality groups with painless DPN. However, a causal relationship of large fiber neuropathy in poor sleep quality cannot be assumed. Previous studies have reported that oxidative stresses are associated with sleep disorders, like obstructive sleep apnea and insomnia [3435]. Therefore, it can be hypothesized that inflammation and oxidative stress in painless DPN [9] might be the cause of poor sleep quality, even in the absence of pain or other neuropathic symptoms.
- Among our study participants, comparison of factors other than CPT between the two sleep quality groups showed differences in the BMI, VFT, SFT, and HOMA-IR. Visceral obesity and insulin resistance have been reported to be associated with obstructive sleep apnea, an important cause of poor sleep quality [3637]. Subcutaneous fat also was reported to be associated with sleep apnea in middle aged female [38]. A recent study by Kline et al. [39] in 2018, reported that sleep was an important correlate of insulin resistance in postmenopausal women with metabolic syndrome. However, whether poor sleep is associated with visceral obesity or insulin resistance among T2DM patients remains unknown.
- None of the glycemic indicators showed significant differences between sleep quality groups in this study. The association between glucose control and sleep quality in T2DM patients is still not clear. A meta-analysis reported by Lee et al. [19] in 2017 suggested that poor sleep quality was associated with higher HbA1c levels. However, consistent with our study, Telford et al. [40] in 2018 reported no association between global PSQI and HbA1c. Other than research design and population demographics, one possible reason for the heterogeneity among the studies may be the difference in the assessment of sleep quality. The meta-analysis of Lee et al. [19] is consist of studies using different cut-off values (global PSQI score >5 to >9). Still, further studies are needed to clarify the association between glucose control and poor sleep quality in T2DM.
- In PSQI subscale comparison, no significant difference in the daytime dysfunction was found between painless DPN and T2DM with no DPN groups. In 2010, Gandhi et al. [31] reported that painful DPN is associated with greater autonomic dysfunction compared to painless DPN. Considering that autonomic dysfunction is one of the factors that badly affect daytime function, it can be assumed that daytime dysfunction of painless DPN is not as bad as painful DPN. Future studies are warranted to clarify the effect of sleep disorders by painless DPN on daytime function.
- The current study has several limitations. First, this study was conducted among hospitalized T2DM patients who needed intense treatment for hyperglycemia, and therefore do not represent the entire T2DM patient population. Considering that DPN usually develops with long time exposure to hyperglycemia, patients in our study were on a relatively short duration of diabetes and poor glycemic control. According to the American Diabetes Association position statement of DPN in 2017 [10], not like type 1 diabetes mellitus, enhanced glucose control in T2DM shows only a modest risk reduction of developing DPN. This suggests that hyperglycemia may not be the only major factor contributing to the development of DPN. Since a certain amount of time of hyperglycemia to develop microvascular complications including DPN proceeds before diagnosing T2DM, the position statement recommends to assess DPN at the initial diagnosis of T2DM. Considering that our participants showed relatively high glucose levels in spite of their short disease duration, it is possible that the patients had asymptomatic hyperglycemia for many years prior to diagnosis of their T2DM. Second, there are several limitations due to the retrospective design of the current study. We have excluded painful DPN by participants' use of peripheral neuropathy medications and it is possible that we have missed some symptomatic DPN patients who are not taking any of those medications. CPT was performed in the T2DM patients with absence of neuropathy symptoms. To find out more about the relationship between poor sleep quality and painless DPN, studies may be needed in the future to compare CPT with PSQI in painful DPN. Also, although drinking is an important factor in sleep disturbance, we only have dichotomous data on alcohol intake. In addition, factors like stress or sleep apnea should be included and evaluated in the future study. Third, the diagnosis of painless DPN was only made by CPT instead of other diagnostic tools including nerve conduction study (NCS), which is recommended as the standard measure of confirming DPN. There are many potential ways of evaluating DPN. A recent brief report suggests that using as many tests and tools as possible is important for early DPN diagnosis with and without neuropathic symptoms [41]. For small fiber neuropathy, pinprick sensation test and thermal discrimination test is classically used. Skin punch biopsy is an objective, gold standard to assess small fibers by quantifying intra-epidermal nerve fibers. Corneal confocal microscopy is a non-invasive ophthalmic image test which is showing promising results on evaluation of C-fibers with consistency in many clinical trials [42]. Ankle reflex examination, vibrameters including 128-Hz tuning fork, proprioception test, and 10-g monofilament test are used in large fiber neuropathy assessment [10]. Considering that our current study regards more with the large fiber neuropathy, those examinations like 10-g monofilament test may be helpful in future studies to figure out more relevant evidence between sleep quality and large fiber neuropathy. Still, although NCS is recommended as the test to confirm DPN, quantitative sensory test (QST) like CPT also has been widely used as a method of assessing DPN [43444546]. Furthermore, since CPT assesses the function of three major types of sensory fibers by using different impulse frequencies, it has been used as a tool of early detection of DPN including its painless type, which is required in current study design [47484950]. We also used CPT subscale tests which were not performed in the previous studies on DPN and poor sleep quality. Additionally, to the best of our knowledge, our study was the first to report the association between painless DPN and sleep quality, using a widely-used objective device and questionnaire.
- In conclusion, the current study showed that painless DPN was associated with poor sleep quality. Additional studies are needed to clarify the pathophysiologic causal relationship between painless DPN and sleep quality.
DISCUSSION
-
Acknowledgements
- None
ACKNOWLEDGMENTS
-
CONFLICTS OF INTEREST
No potential conflict of interest relevant to this article was reported.
-
AUTHOR CONTRIBUTIONS
Conception or design: J.O.M.
Acquisition, analysis, or interpretation of data: D.C., C.H.J.
Drafting the work or revising: D.C., B.Y.K., C.H.J., C.H.K.
Final approval of the manuscript: D.C., B.Y.K., C.H.J., C.H.K., J.O.M.
-
FUNDING
The study was funded by the Soonchunhyang University Research Fund.
NOTES
SUPPLEMENTARY MATERIALS
Supplementary Table 1
Supplementary Fig. 1
- 1. Solli O, Stavem K, Kristiansen IS. Health-related quality of life in diabetes: the associations of complications with EQ-5D scores. Health Qual Life Outcomes 2010;8:18.ArticlePubMedPMC
- 2. Hayes A, Arima H, Woodward M, Chalmers J, Poulter N, Hamet P, et al. Changes in quality of life associated with complications of diabetes: results from the ADVANCE Study. Value Health 2016;19:36-41.ArticlePubMed
- 3. Sridhar GR, Madhu K. Prevalence of sleep disturbances in diabetes mellitus. Diabetes Res Clin Pract 1994;23:183-6.ArticlePubMed
- 4. Cappuccio FP, D'Elia L, Strazzullo P, Miller MA. Quantity and quality of sleep and incidence of type 2 diabetes: a systematic review and meta-analysis. Diabetes Care 2010;33:414-20.PubMed
- 5. Narisawa H, Komada Y, Miwa T, Shikuma J, Sakurai M, Odawara M, et al. Prevalence, symptomatic features, and factors associated with sleep disturbance/insomnia in Japanese patients with type-2 diabetes. Neuropsychiatr Dis Treat 2017;13:1873-80.ArticlePubMedPMCPDF
- 6. Knutson KL, Ryden AM, Mander BA, Van Cauter E. Role of sleep duration and quality in the risk and severity of type 2 diabetes mellitus. Arch Intern Med 2006;166:1768-74.ArticlePubMed
- 7. Van Cauter E, Spiegel K, Tasali E, Leproult R. Metabolic consequences of sleep and sleep loss. Sleep Med 2008;9 Suppl 1:S23-8.PubMed
- 8. Barone MT, Menna-Barreto L. Diabetes and sleep: a complex cause-and-effect relationship. Diabetes Res Clin Pract 2011;91:129-37.ArticlePubMed
- 9. Tesfaye S, Boulton AJ, Dyck PJ, Freeman R, Horowitz M, Kempler P, et al. Diabetic neuropathies: update on definitions, diagnostic criteria, estimation of severity, and treatments. Diabetes Care 2010;33:2285-93.ArticlePubMedPMCPDF
- 10. Pop-Busui R, Boulton AJ, Feldman EL, Bril V, Freeman R, Malik RA, et al. Diabetic neuropathy: a position statement by the American Diabetes Association. Diabetes Care 2017;40:136-54.ArticlePubMedPDF
- 11. Gore M, Brandenburg NA, Dukes E, Hoffman DL, Tai KS, Stacey B. Pain severity in diabetic peripheral neuropathy is associated with patient functioning, symptom levels of anxiety and depression, and sleep. J Pain Symptom Manage 2005;30:374-85.ArticlePubMed
- 12. Zelman DC, Brandenburg NA, Gore M. Sleep impairment in patients with painful diabetic peripheral neuropathy. Clin J Pain 2006;22:681-5.ArticlePubMed
- 13. Won JC, Im YJ, Lee JH, Kim CH, Kwon HS, Cha BY, et al. Clinical phenotype of diabetic peripheral neuropathy and relation to symptom patterns: cluster and factor analysis in patients with type 2 diabetes in Korea. J Diabetes Res 2017;2017:5751687.ArticlePubMedPMCPDF
- 14. Dermanovic Dobrota V, Hrabac P, Skegro D, Smiljanic R, Dobrota S, Prkacin I, et al. The impact of neuropathic pain and other comorbidities on the quality of life in patients with diabetes. Health Qual Life Outcomes 2014;12:171.ArticlePubMedPMCPDF
- 15. Buysse DJ, Reynolds CF 3rd, Monk TH, Berman SR, Kupfer DJ. The Pittsburgh Sleep Quality Index: a new instrument for psychiatric practice and research. Psychiatry Res 1989;28:193-213.ArticlePubMed
- 16. Carpenter JS, Andrykowski MA. Psychometric evaluation of the Pittsburgh Sleep Quality Index. J Psychosom Res 1998;45:5-13.ArticlePubMed
- 17. Buysse DJ, Reynolds CF 3rd, Monk TH, Hoch CC, Yeager AL, Kupfer DJ. Quantification of subjective sleep quality in healthy elderly men and women using the Pittsburgh Sleep Quality Index (PSQI). Sleep 1991;14:331-8.PubMed
- 18. Gentili A, Weiner DK, Kuchibhatla M, Edinger JD. Test-retest reliability of the Pittsburgh Sleep Quality Index in nursing home residents. J Am Geriatr Soc 1995;43:1317-8.ArticlePubMed
- 19. Lee SWH, Ng KY, Chin WK. The impact of sleep amount and sleep quality on glycemic control in type 2 diabetes: a systematic review and meta-analysis. Sleep Med Rev 2017;31:91-101.ArticlePubMed
- 20. Levey AS, Coresh J, Balk E, Kausz AT, Levin A, Steffes MW, et al. National Kidney Foundation practice guidelines for chronic kidney disease: evaluation, classification, and stratification. Ann Intern Med 2003;139:137-47.ArticlePubMed
- 21. Matthews DR, Hosker JP, Rudenski AS, Naylor BA, Treacher DF, Turner RC. Homeostasis model assessment: insulin resistance and beta-cell function from fasting plasma glucose and insulin concentrations in man. Diabetologia 1985;28:412-9.ArticlePubMedPDF
- 22. Kawamoto R, Ohtsuka N, Ninomiya D, Nakamura S. Association of obesity and visceral fat distribution with intima-media thickness of carotid arteries in middle-aged and older persons. Intern Med 2008;47:143-9.ArticlePubMed
- 23. Rendell MS, Dovgan DJ, Bergman TF, O'Donnell GP, Drobny EP, Katims JJ. Mapping diabetic sensory neuropathy by current perception threshold testing. Diabetes Care 1989;12:636-40.ArticlePubMedPDF
- 24. Wallace MS, Dyck JB, Rossi SS, Yaksh TL. Computer-controlled lidocaine infusion for the evaluation of neuropathic pain after peripheral nerve injury. Pain 1996;66:69-77.ArticlePubMed
- 25. Dotson RM. Clinical neurophysiology laboratory tests to assess the nociceptive system in humans. J Clin Neurophysiol 1997;14:32-45.ArticlePubMed
- 26. Katims JJ, Rouvelas P, Sadler BT, Weseley SA. Current perception threshold: reproducibility and comparison with nerve conduction in evaluation of carpal tunnel syndrome. ASAIO Trans 1989;35:280-4.PubMed
- 27. Takekuma K, Ando F, Niino N, Shimokata H. Prevalence of hyperesthesia detected by current perception threshold test in subjects with glucose metabolic impairments in a community. Intern Med 2002;41:1124-9.ArticlePubMed
- 28. Bansal V, Kalita J, Misra UK. Diabetic neuropathy. Postgrad Med J 2006;82:95-100.ArticlePubMedPMCPDF
- 29. Nather A, Keng Lin W, Aziz Z, Hj Ong C, Mc Feng B, B Lin C. Assessment of sensory neuropathy in patients with diabetic foot problems. Diabet Foot Ankle 2011 2:https://doi.org/10.3402/dfa.v2i0.6367.Article
- 30. Spallone V, Greco C. Painful and painless diabetic neuropathy: one disease or two? Curr Diab Rep 2013;13:533-49.ArticlePubMedPDF
- 31. Gandhi RA, Marques JL, Selvarajah D, Emery CJ, Tesfaye S. Painful diabetic neuropathy is associated with greater autonomic dysfunction than painless diabetic neuropathy. Diabetes Care 2010;33:1585-90.ArticlePubMedPMCPDF
- 32. Blesneac I, Themistocleous AC, Fratter C, Conrad LJ, Ramirez JD, Cox JJ, et al. Rare NaV1.7 variants associated with painful diabetic peripheral neuropathy. Pain 2018;159:469-80.ArticlePubMed
- 33. Shillo P, Sloan G, Greig M, Hunt L, Selvarajah D, Elliott J, et al. Painful and painless diabetic neuropathies: what is the difference? Curr Diab Rep 2019;19:32.ArticlePubMedPMCPDF
- 34. Gulec M, Ozkol H, Selvi Y, Tuluce Y, Aydin A, Besiroglu L, et al. Oxidative stress in patients with primary insomnia. Prog Neuropsychopharmacol Biol Psychiatry 2012;37:247-51.ArticlePubMed
- 35. Yamauchi M, Nakano H, Maekawa J, Okamoto Y, Ohnishi Y, Suzuki T, et al. Oxidative stress in obstructive sleep apnea. Chest 2005;127:1674-9.ArticlePubMed
- 36. Shinohara E, Kihara S, Yamashita S, Yamane M, Nishida M, Arai T, et al. Visceral fat accumulation as an important risk factor for obstructive sleep apnoea syndrome in obese subjects. J Intern Med 1997;241:11-8.ArticlePubMedPDF
- 37. Ip MS, Lam B, Ng MM, Lam WK, Tsang KW, Lam KS. Obstructive sleep apnea is independently associated with insulin resistance. Am J Respir Crit Care Med 2002;165:670-6.ArticlePubMed
- 38. Kritikou I, Basta M, Tappouni R, Pejovic S, Fernandez-Mendoza J, Nazir R, et al. Sleep apnoea and visceral adiposity in middle-aged male and female subjects. Eur Respir J 2013;41:601-9.ArticlePubMed
- 39. Kline CE, Hall MH, Buysse DJ, Earnest CP, Church TS. Poor sleep quality is associated with insulin resistance in postmenopausal women with and without metabolic syndrome. Metab Syndr Relat Disord 2018;16:183-9.ArticlePubMedPMC
- 40. Telford O, Diamantidis CJ, Bosworth HB, Patel UD, Davenport CA, Oakes MM, et al. The relationship between Pittsburgh Sleep Quality Index subscales and diabetes control. Chronic Illn 2019;15:210-9.ArticlePubMedPDF
- 41. Park JH, Kim DS. The necessity of the simple tests for diabetic peripheral neuropathy in type 2 diabetes mellitus patients without neuropathic symptoms in clinical practice. Diabetes Metab J 2018;42:442-6.ArticlePubMedPMCPDF
- 42. Petropoulos IN, Ponirakis G, Khan A, Almuhannadi H, Gad H, Malik RA. Diagnosing diabetic neuropathy: something old, something new. Diabetes Metab J 2018;42:255-69.ArticlePubMedPMCPDF
- 43. Masson EA, Veves A, Fernando D, Boulton AJ. Current perception thresholds: a new, quick, and reproducible method for the assessment of peripheral neuropathy in diabetes mellitus. Diabetologia 1989;32:724-8.ArticlePubMedPDF
- 44. Lacomis D. Small-fiber neuropathy. Muscle Nerve 2002;26:173-88.ArticlePubMed
- 45. Matsutomo R, Takebayashi K, Aso Y. Assessment of peripheral neuropathy using measurement of the current perception threshold with the neurometer in patients with type 2 diabetes mellitus. J Int Med Res 2005;33:442-53.ArticlePubMedPDF
- 46. Santos TRM, Melo JV, Leite NC, Salles GF, Cardoso CRL. Usefulness of the vibration perception thresholds measurement as a diagnostic method for diabetic peripheral neuropathy: results from the Rio de Janeiro type 2 diabetes cohort study. J Diabetes Complications 2018;32:770-6.ArticlePubMed
- 47. Inceu GV, Veresiu IA. Measurement of current perception thresholds using the Neurometer(®): applicability in diabetic neuropathy. Clujul Med 2015;88:449-52.PubMedPMC
- 48. Park KS, Kwon YC, Youn M, Park YS, Hong YH, Sung JJ. Current perception threshold in diabetic sensory polyneuropathy with normal routine nerve conduction study. Ann Clin Neurophysiol 2017;19:125-30.ArticlePDF
- 49. Park JH, Won JC. Patterns of nerve conduction abnormalities in patients with type 2 diabetes mellitus according to the clinical phenotype determined by the current perception threshold. Diabetes Metab J 2018;42:519-28.ArticlePubMedPMCPDF
- 50. Piao Z, Wang L, Fu X, Liang M, Che H. Applications of current perception threshold evaluations in discovering early diabetic peripheral neuropathy. J Chin Physician 2018;20:941-3.
REFERENCES
Flow diagram for selection of study subjects. T2DM, type 2 diabetes mellitus; DPN, diabetic peripheral neuropathy; CPT, current perception threshold; PSQI, Pittsburgh Sleep Quality Index.


Values are presented as mean±standard deviation.
FPG, fasting plasma glucose; HbA1c, glycosylated hemoglobin; HOMA-IR, homeostasis model assessment of insulin resistance; AST, aspartate aminotransferase; ALT, alanine aminotransferase; LDL-C, low density lipoprotein cholesterol; HDL-C, high density lipoprotein cholesterol; eGFR, estimated glomerular filtration rate.
| Variable | Painless DPN (n=76) | No DPN (n=70) | P value |
|---|---|---|---|
| Global PSQI | 7.3±3.9 | 5.2±2.9 | <0.001 |
| Self-reported sleep quality | 1.5±0.8 | 1.3±0.8 | 0.327 |
| Sleep latency | 1.5±1.2 | 1.1±1.0 | 0.009 |
| Sleep duration | 1.3±1.2 | 0.8±1.0 | 0.007 |
| Sleep efficiency | 0.7±1.0 | 0.3±0.7 | 0.006 |
| Sleep disturbance | 1.3±0.6 | 1.2±0.5 | 0.696 |
| Use of sleep medications | 0.3±0.9 | 0.1±0.4 | 0.052 |
| Daytime dysfunction | 0.7±0.8 | 0.6±1.3 | 0.485 |
| Poor sleep qualitya | 49 (64.5) | 21 (30.0) | <0.001 |
OR, odds ratio; CI, confidence interval; T2DM, type 2 diabetes mellitus; HTN, hypertension; BMI, body mass index; VFT, visceral fat thickness; SFT, subcutaneous fat thickness; ARB, angiotensin II receptor blocker; FPG, fasting plasma glucose; HbA1c, glycosylated hemoglobin; HOMA-IR, homeostasis model assessment of insulin resistance; AST, aspartate aminotransferase; ALT, alanine aminotransferase; TC, total cholesterol; LDL-C, low density lipoprotein cholesterol; HDL-C, high density lipoprotein cholesterol; eGFR, estimated glomerular filtration rate; DPN, diabetic peripheral neuropathy.
Figure & Data
References
Citations
- Deteriorated sleep quality and associate factors in patients with type 2 diabetes mellitus complicated with diabetic peripheral neuropathy
Lin Fu, Liping Zhong, Xin Liao, Lingrui Wang, Youyi Wang, Xiuquan Shi, Yanna Zhou
PeerJ.2024; 12: e16789. CrossRef - Sleep impairment: Is it an overlooked burden in painful diabetic peripheral neuropathy? A single-centre, cross-sectional study from south India
Adlin Lawrence, Himsikhar Khataniar, Sinimol Joseph, Thenmozhi Nagarajan, Soumya Umesh, John Michael Raj A
Diabetes & Metabolic Syndrome: Clinical Research & Reviews.2022; 16(8): 102568. CrossRef - Sleep: an emerging therapeutic target in diabetes care
Nishant Raizada, S. V. Madhu
International Journal of Diabetes in Developing Countries.2021; 41(1): 1. CrossRef
 PubReader
 ePub Link
 Cite
Cite